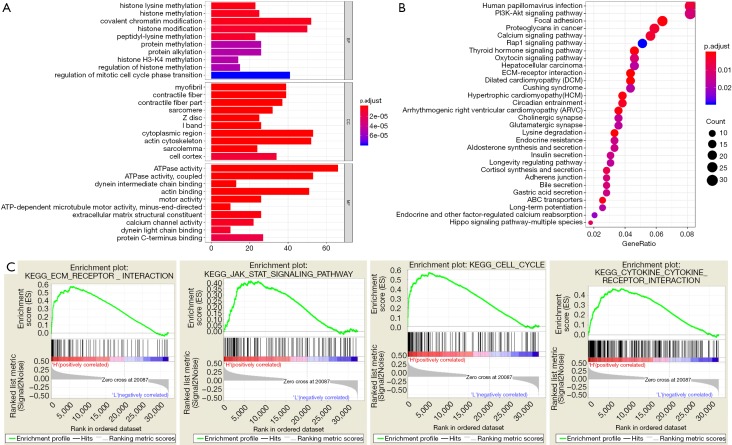
Figure 6.
Functional pathway analysis based on top 400 mutant genes. (A,B) GO and KEGG pathway analysis for mutated genes; (C) GSEA results showed that the TMB-related risk score correlated with ECM-receptor interaction, JAK-STAT signaling pathway, cell cycle or cytokine receptor interaction. GO, gene ontology; GSEA, Gene Set Enrichment Analysis; TMB, tumor mutation burden; ECM, extracellular matrix.

