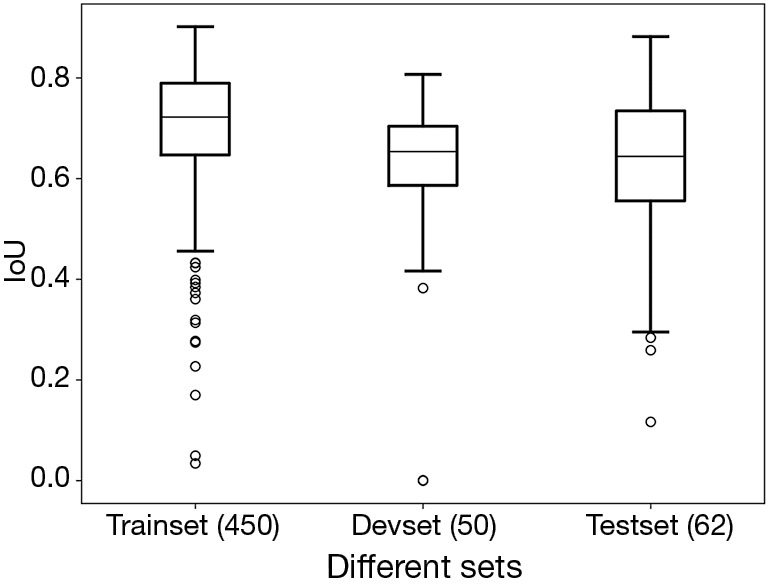
Figure 3.

The boxplot of IoUs from different datasets. The line inside the box refers to the median IoU. The upper and lower edges of box refer to the quartiles. The top and bottom line of boxplot refers to the extreme value of IoUs. The small bubbles refer to outliers. IoU, intersection over union; Devset, development set.
