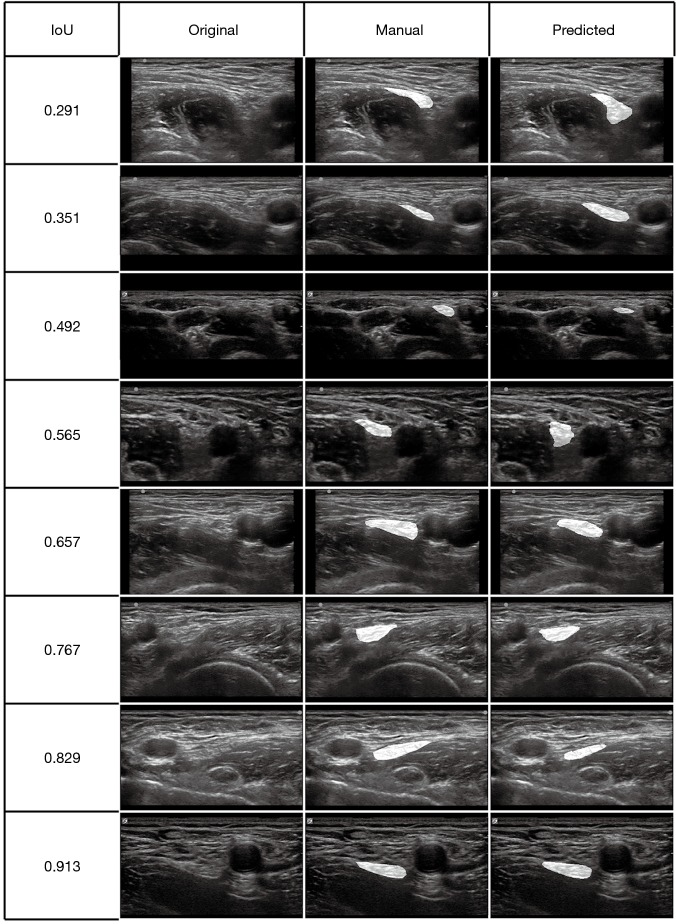
Figure 4.
Representative ultrasound images from the test set at different IoU levels. Each row represents the images of one patient at a certain IoU level. The first column represents the original images, the second represents images with manual masks, and the third represents images with predicted masks. Both manual masks and predicted masks are highlighted on the original images. IoU, intersection over union.

