
Figure 1.
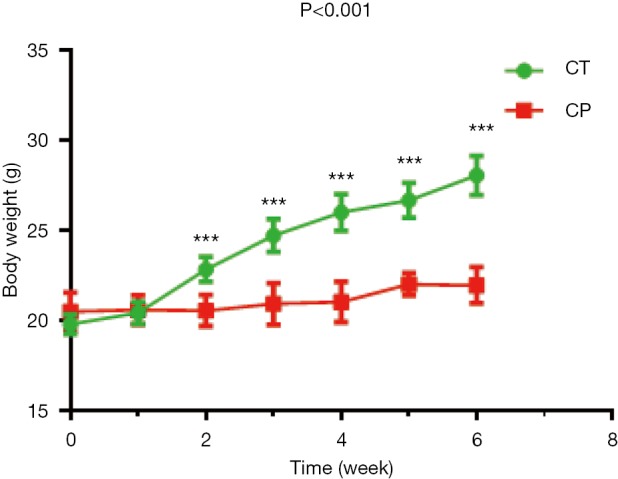
Body weights of the C57BL/6 mice with CP (red), or CT (green) for 6 weeks were recorded. Each value is expressed as the mean ± SD. ***, P<0.001. CP, chronic pancreatitis mice; CT, control mice; SD, standard deviation.
Official websites use .gov
A
.gov website belongs to an official
government organization in the United States.
Secure .gov websites use HTTPS
A lock (
) or https:// means you've safely
connected to the .gov website. Share sensitive
information only on official, secure websites.
Body weights of the C57BL/6 mice with CP (red), or CT (green) for 6 weeks were recorded. Each value is expressed as the mean ± SD. ***, P<0.001. CP, chronic pancreatitis mice; CT, control mice; SD, standard deviation.