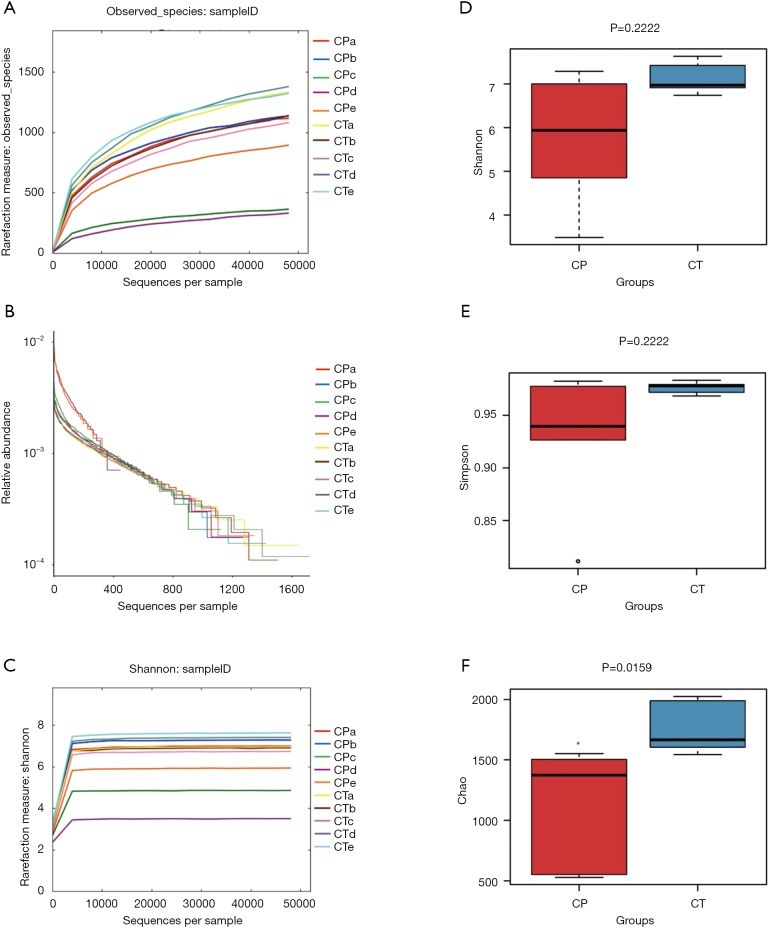
Figure 4.
The characteristics of the diversity, richness, and structure of the intestinal flora in the two groups of mice. (A,B,C) OTU rank curves, rarefaction curves and Shannon curves of gut microbiota for each sample, respectively; (D,E,F) shows the Shannon index, Simpson index, and Chao1 index of each group. Values are presented as median (quartile) (n=5). Differences were assessed by Mann-Whitney-Wilcoxon test and denoted as follows: *, P<0.05; **, P<0.01 compared with CT group. OTU, operational taxonomic unit; CP, chronic pancreatitis mice; CT, control mice.

