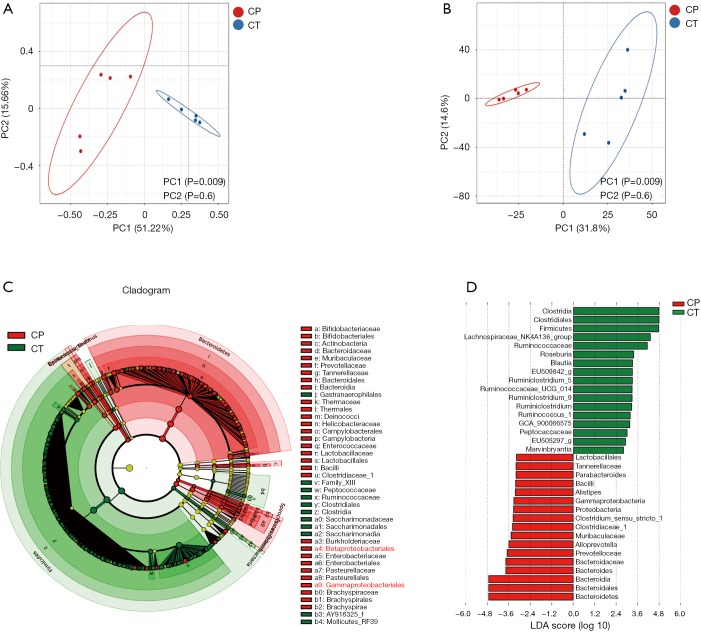
Figure 6.
Bacterial composition of the different communities in the two groups. (A,B) Plot of unweighted UniFrac principal coordinates were scored on the relative abundance of OTU (97% similarity level). Each dot denotes a sample. Blue dots represent the CT group and red dots represent the CP group; (C) cladogram of the LDA scores showing the differentially abundant genera; (D) key microbiota contributing to the composition of gut microbiota in the fecal samples of the two groups. OTU, operational taxonomic unit; CP, chronic pancreatitis mice; CT, control mice; PCoA, principal coordinate analysis; PCA, principal component analysis; LDA, linear discriminant analysis.

