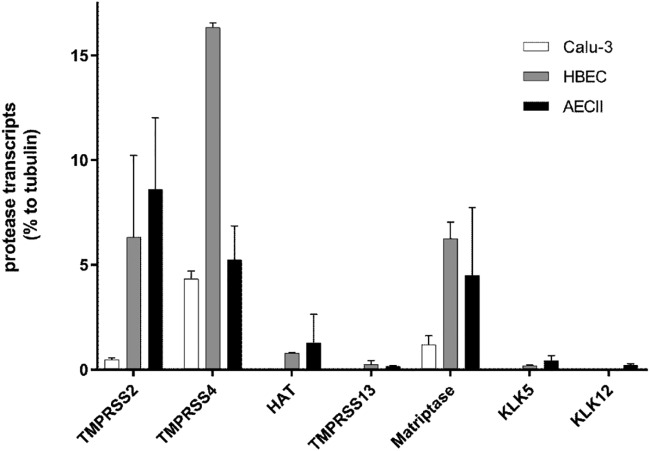
FIG 2.
RT-qPCR analysis of HA-cleaving protease transcripts in Calu-3 cells, HBEC, and AECII. Total RNA was isolated from Calu-3 cells, HBEC cultures, or AECII. Relative mRNA expression levels (percent) of selected proteases were measured by RT-qPCR and normalized by using tubulin as an internal control. Data are mean values ± SD (n = 3).

