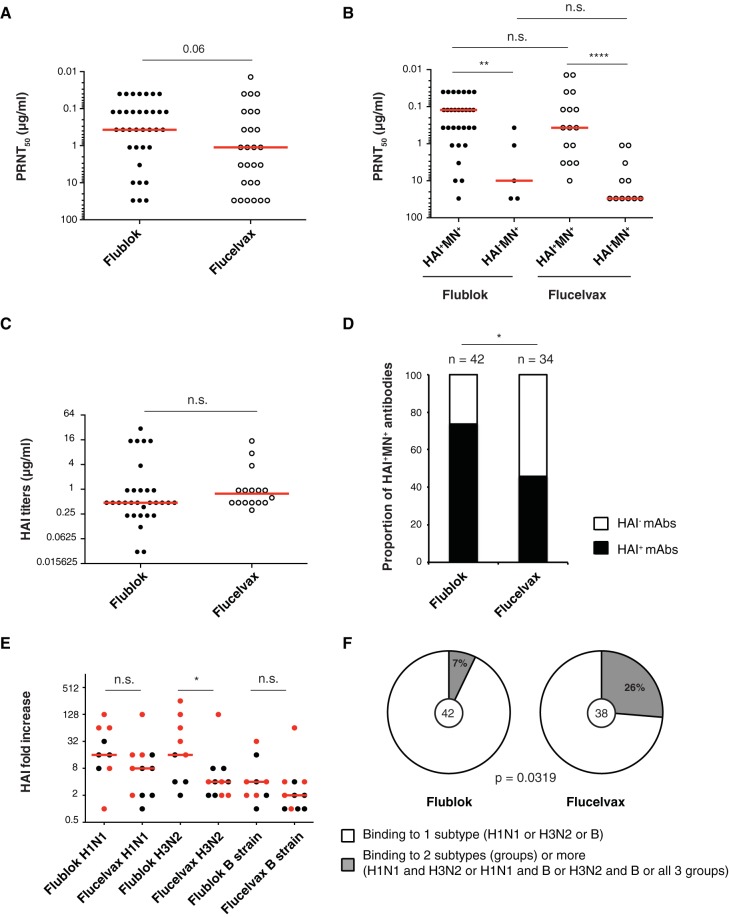
FIG 4.
Characterization of MAbs induced by Flublok or Flucelvax immunization. (A to C) Hemagglutination inhibition assay (HAI) and in vitro neutralization by plaque reduction neutralization assay. Each dot represents one antibody. Statistical significance was determined by Mann-Whitney test. The assays were performed 2 to 3 times for each antibody. (A) PRNT50 (μg/ml) for all neutralizing Flublok (n = 35)- and Flucelvax (n = 27)-induced MAbs. (B) PRNT50 (μg/ml) for HAI+ MN+ versus HAI− MN+ neutralizing Flublok- and Flucelvax-induced MAbs. (C) HAI titers (μg/ml) for Flublok (n = 31)- and Flucelvax (n = 16)-induced MAbs. (D) Proportion of HAI+ MN+ MAbs out of the total number of HA-reactive MAbs induced by Flublok (n = 42) or Flucelvax (n = 34). Statistical significance was determined by Fisher’s exact test. (E) Serum antibody HAI titers in Flublok (n = 9)- or Flucelvax (n = 11)-vaccinated individuals. Each dot represents the fold change increase between d0 and d28 in an individual subject. Red dots represent the subjects from which MAbs were cloned. Medians are represented in red. Testing for statistical significance was performed using a Mann-Whitney U test. HAI titer absolute values can be found in Table 1. (F) Percentage of virus-reactive MAbs induced by Flublok or Flucelvax binding to only one subtype (H1N1, H3N2, or B strain). Statistical significance was determined by Fisher’s exact test. The number in the middle of the pie charts represents the total number of virus-reactive MAbs tested.

