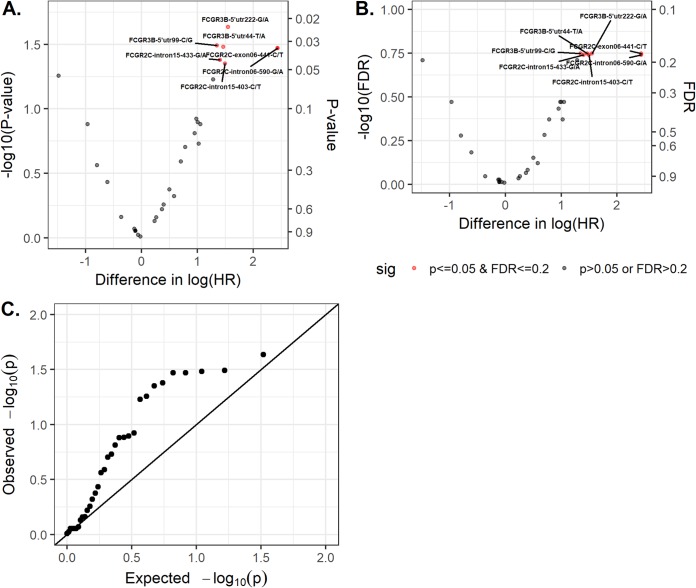
FIG 1.
Assessment of whether and how each of the 33 FcγR SNPs modified the hazard ratio (vaccine/placebo) of HIV acquisition in HVTN 505. (A) Volcano plot of P value for the interaction between genotype and treatment arm (y axis, −log10 scale) versus difference in estimated log(HR) (vaccine/placebo) between genotype groups (x axis). (B) Volcano plot of false discovery rate (FDR) (y axis, −log10 scale) versus difference in estimated log(HR) between genotype groups (x axis). Red dots represent FcγR SNPs that significantly modify the HR (vaccine/placebo). (C) Quantile-quantile plot of the observed and expected P values (−log10 scale for both).

