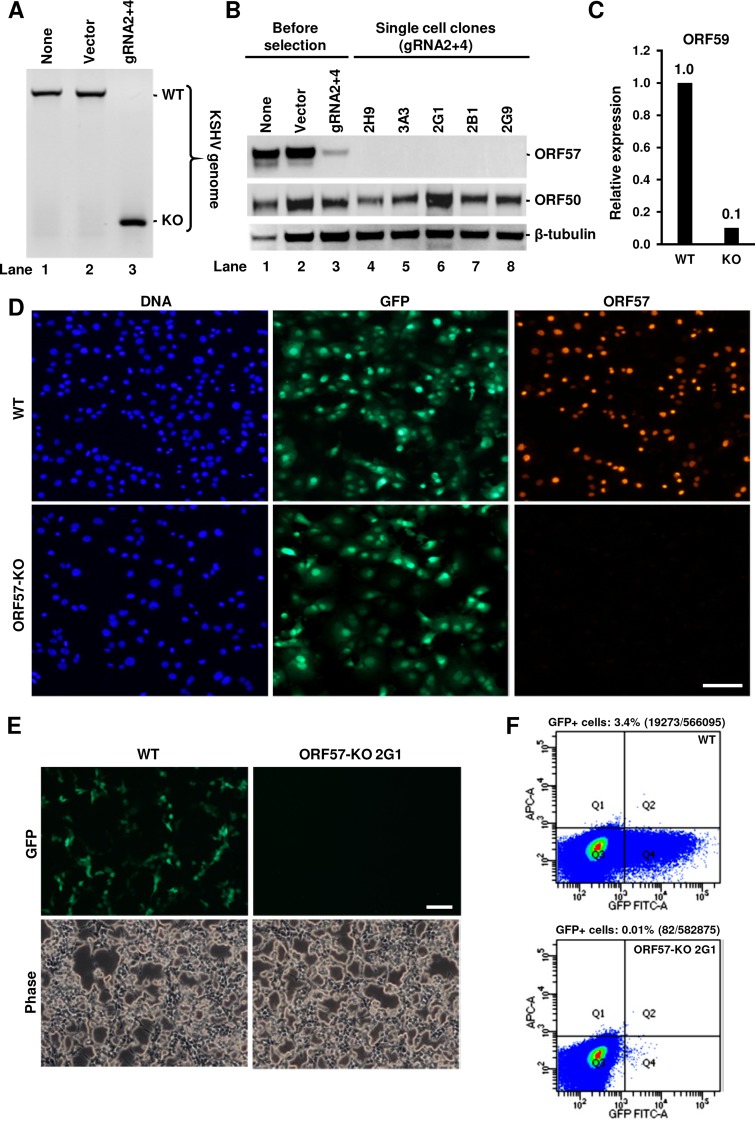
FIG 8.
Detrimental effect of CRISPR/Cas9-mediated ORF57 KO on KSHV genome expression and virion production in iSLK/Bac16 cells containing a stably transfected KSHV-GFP genome. (A to C) PCR screen of ORF57 KO efficiency using flanking primers Pr1 plus Pr2 (Fig. 1A) in the untransfected iSLK/Bac16 cells (none) or the cells transfected by a Cas9-only empty vector (vector) or a gRNA 2 plus 4 expression vector (gRNA2 + 4) (A). Characterization of the ORF57 KO genome for expression of ORF50, ORF57, and ORF59 in the selected single-cell clones. The iSLK/Bac16 cells with or without transfection by a Cas9-only empty vector (vector) or a gRNA 2 plus 4 expression vector (gRNA2 + 4) as described in the legend for Fig. 3 were subjected to single-cell cloning and screening before induction of KSHV lytic replication by doxycycline and sodium butyrate. Total cell lysates and RNA before and after selection of single cell clones and viral lytic induction were prepared for Western blot analyses of KSHV ORF50 and ORF57 (B) and for RT-qPCR analysis of ORF59 (C). Cells without transfection (none) or transfected with a Cas9-only vector (vector) before selection served as controls and cellular β-tubulin served as a loading control (B). (D) WT and ORF57 KO cells with lytic induction by Dox plus Bu for 24 h were examined for GFP expression level in association with KSHV genome copies. The expression of ORF57 was examined by anti-ORF57 IF staining to determine ORF57 KO efficiency. Bar, 100 μm. Effect of ORF57 KO on infectious KSHV production. (E and F) Titration of cell-free virus production from Dox- plus Bu-induced iSLK/Bac16 cells carrying a KSHV WT or ORF57 KO (clone 2G1) genome was carried out in HEK293T cells by using the corresponding cell culture medium collected 5 days after viral lytic induction. The newly infected HEK293T cells expressing GFP as indications of GFP-KSHV virus infection were imaged by direct fluorescence (E) and then counted by FACS analysis (F) 48 h after infection. The percentages of GFP+ cells over total number of cells were calculated based on the cell counts in the Q4 region (F).

