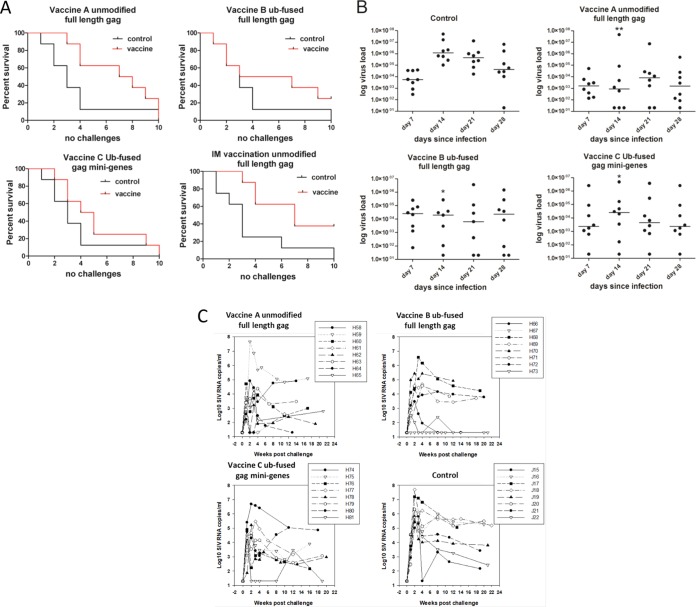
FIG 1.
gag vaccination delays infection from intrarectal challenge with low-dose SIV and reduces virus load. (A) Kaplan-Meier survival curves showing time to infection, indicated as the number of weekly challenges, for vaccinated animals (red lines) and controls (black lines). Animals vaccinated i.d. with full-length unmodified gag gene resisted infection (P = 0.0081, which remained significant after Bonferroni’s correction). Animals vaccinated i.d. with the full-length gag gene fused at the N terminus to the ubiquitin (Ub) gene (P = 0.313) and animals vaccinated i.d. with 7 mini genes spanning the whole of gag with each gene fused to the ubiquitin gene at the N terminus (P = 0.139) were not protected. Animals vaccinated i.m. with full-length unmodified gag gene resisted infection (P = 0.023). The 16 controls used for these analyses combined the 8 naive controls challenged in parallel with vaccine groups A to C and a separate group of 8 naive controls challenged in parallel with the IM vaccinations (group D), which were performed subsequently to vaccinations A to C. Significance between curves was determined by the Gehan-Breslow-Wilcoxon test. (B) gag vaccination suppresses peak plasma virus RNA load. Median and individual virus loads are shown on days 7, 14, 21, and 28 for control and vaccinated animals and peaks at day 14 in controls. In all three vaccine groups, the virus load is significantly lower at day 14. Animals were vaccinated i.d. with full-length unmodified gag gene (P < 0.01), full-length gag gene fused at the N terminus to the ubiquitin gene (P < 0.05), and 7 mini genes spanning the whole of gag with each gene fused to the ubiquitin gene at the N terminus (P < 0.01). Results were analyzed by the Kruskal-Wallis test with Dunn’s multiple comparison correction. *, P < 0.05; **, P < 0.01. (C) Virus load for each macaque over time infected. Individual plasma viral RNA kinetics for vaccine groups A to C are compared to those of naive unvaccinated control animals. For each macaque, data are plotted from the time of the first positive qRT-PCR and sequentially thereafter, showing the time course of infection kinetics for each animal, in most cases up to 20 weeks postinfection.

