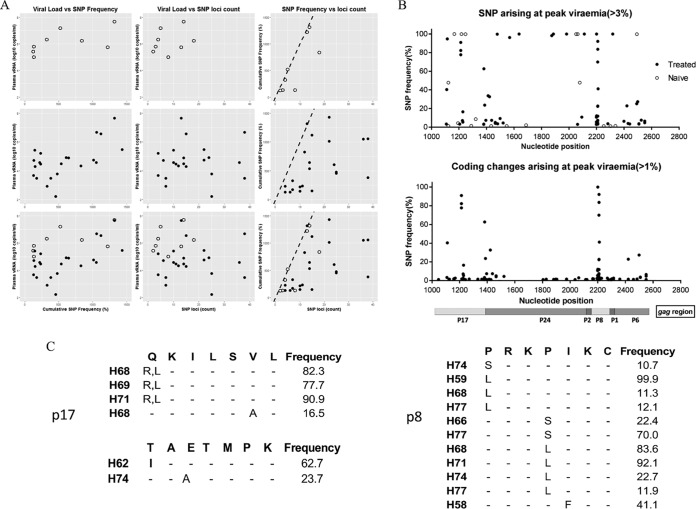
FIG 2.
Nucleotide and amino acid changes across gag (Gag) in infected vaccinated and control animals. (A) Relationships between SNP frequency and viral load SNP loci across gag determined with a variant frequency greater than 1% were counted and summed across loci. These were plotted to the viral load of the sample and to each other represented as (i) vRNA load against SNP frequency, (ii) viral load against SNP loci count, and (iii) SNP frequency versus loci count; dotted lines indicate the position at which all loci were fixed at 100%. (B) Upper plot, SNP changes across gag. The frequency and position of SNPs not present in the challenge inocula are shown. Samples are shown against their frequency above 3% for vaccine-treated (closed circles) and naive (open circles) animals. Lower plot, positions of nonsynonymous changes and their frequency above 1% in treated vaccinated animals with an identifiable amino acid change. A schematic of the regions of the gag polyprotein are shown. (C) Identified high-frequency mutations in p17 and p6 regions in gag-vaccinated animals are shown. Three short regions corresponding to gag where samples have nonsynonymous changes at frequencies above 10% and not seen in the inocula are shown for matrix p17 (amino acids 58 to 65 and 114 to 121) and in nucleocapsid p8 (amino acids 387 to 394).

