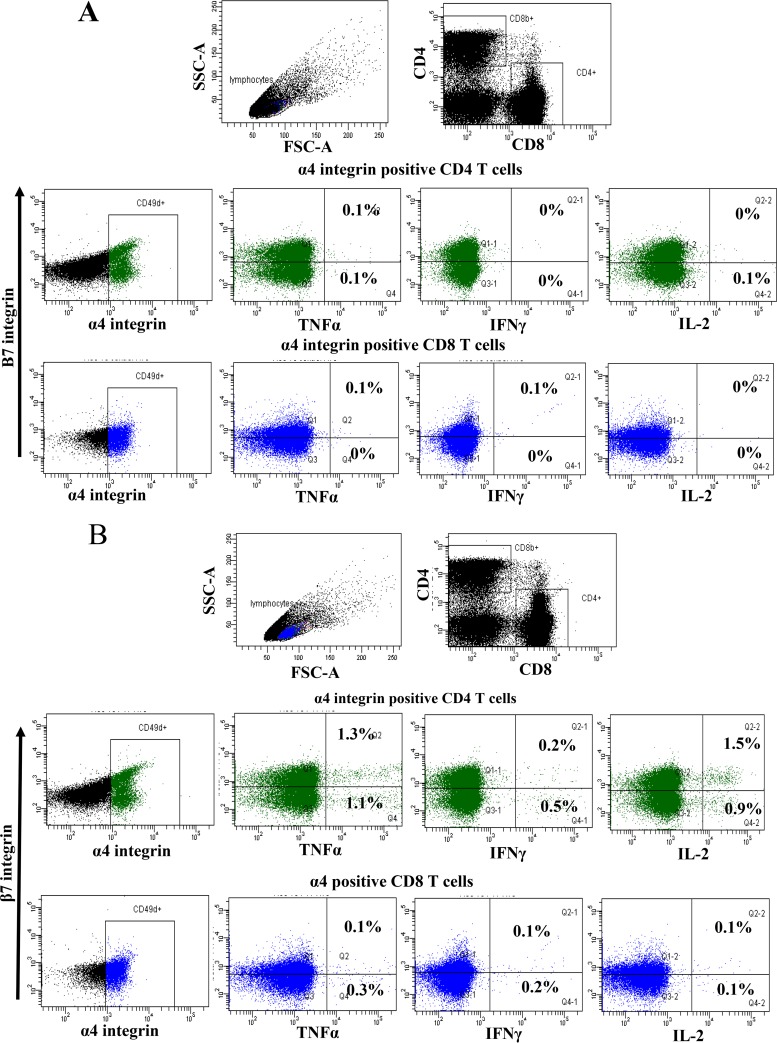
FIG 3.
Flow cytometry analysis from a representative immunized macaque. (A) Plot of PBMCs from a vaccine group A animal (H58) at day 147 showing α4 integrin-positive CD4 and CD8 cells staining for TNF-α, IFN-γ, or IL-2 after stimulation with the DMSO control. (B) Flow cytometry plot of PBMCs from a vaccine group A animal (H58) at day 147 showing α4 integrin-positive CD4 and CD8 cells staining for TNF-α, IFN-γ, or IL-2 after stimulation with a p17 peptide pool.

