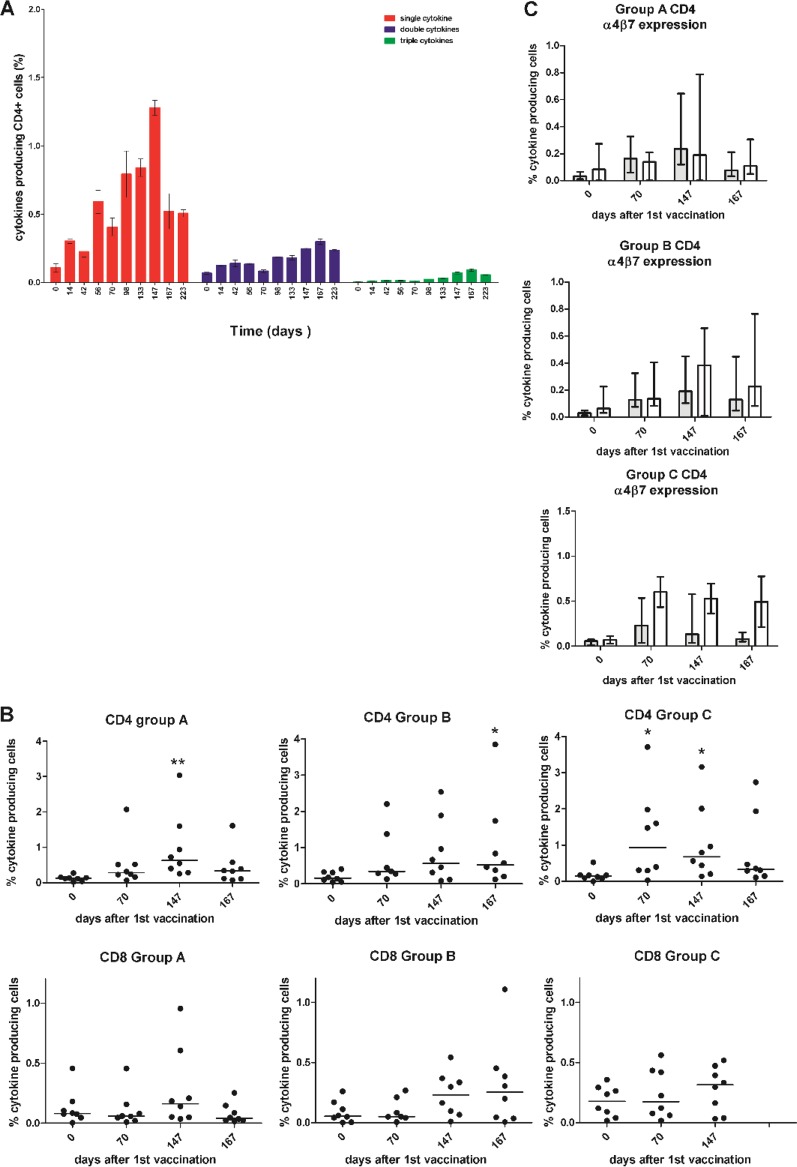
FIG 4.
T cell cytokine analysis. (A) CD4 T cells producing 1, 2, or 3 cytokines shown by a representative vaccine group A animal (H58). Means and standard errors (SE) are shown for results from triplicate samples. (B) The percentage of cytokine-producing CD4 and CD8 T cells (IFN-γ, IL-2, or TNF-α) in vaccinated animals is shown for the three vaccine groups: animals vaccinated i.d. with the full-length unmodified gag gene, those vaccinated with the full-length gag gene fused at the N terminus to the ubiquitin gene, and those vaccinated with 7 mini genes spanning the whole of gag with each gene fused to the ubiquitin gene at the N terminus. *, P < 0.05; **, P < 0.01. Data were analyzed by the Kruskal-Wallis test with Dunn’s multiple comparison correction. Immunological analyses were not performed in animals from the i.m. vaccinated group D. (C) Percentage of cytokine-positive cells (median and interquartile range) that are α4β7 positive (filled bars) or negative (open bars) for CD4 T cells for vaccine groups A, B, and C.

