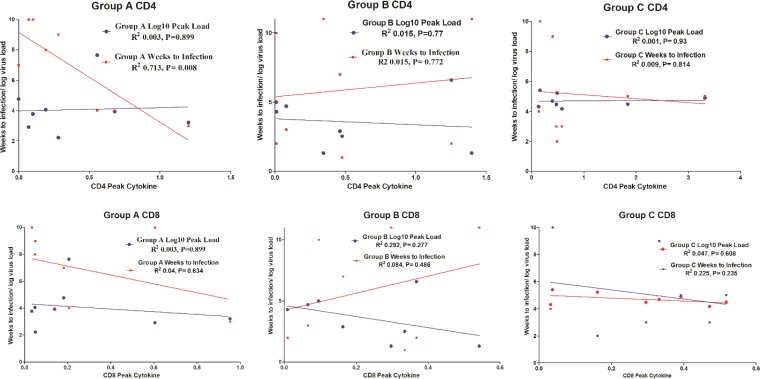
FIG 5.
Correlation between peak cytokine response and time to infection/peak virus load. The highest percentage of CD4 and CD8 T cells secreting cytokine following vaccination (peak cytokine production) is plotted against time in weeks to infection (red lines) and against peak virus load (blue lines) for vaccine groups A, B, and C. For the CD4 response in vaccine group A, there is a significant correlation with time to infection after weekly challenges (P = 0.008, r2 = 0.7). There is no significant correlation of these parameters in vaccine groups B and C. There is no significant correlation between peak cytokine production and time to infection for CD8 T cells from any vaccine group. Similarly, there is no significant correlation between peak cytokine production and peak virus load for CD4 or CD8 cells from any vaccination group.

