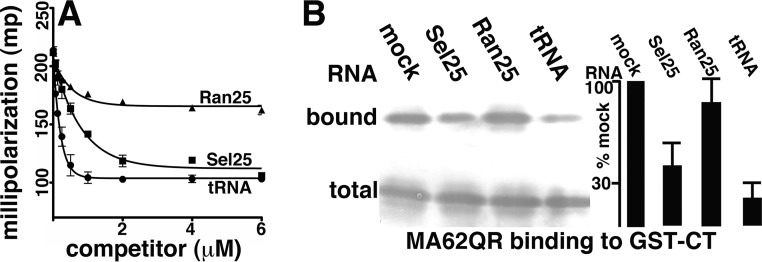
FIG 5.
RNA effects on 62QR MA binding to CT. (A) Fluorescence anisotropy competition binding assays were performed with 1 μM 62QR MA, 10 nM fluorescently tagged Sel25 RNA ligand, and increasing concentrations of untagged Ran25, Sel25, or yeast tRNA ligands to achieve the final indicated concentrations. Competition assays from three separate experiments are plotted as millipolarization-versus-competitor concentration graphs and fitted assuming exponential-decay binding curves. (B) GST-CT binding assays were performed with 62QR MA, and bound versus total 62QR MA levels were monitored as described in the legend to Fig. 2B. Binding assays were performed in the absence of RNA (mock) or in the presence of 5 μM Sel25, Ran25, or yeast tRNA ligand, as indicated. At the far right, levels of 62QR MA binding to GST-CT beads for incubations in the presence of RNAs were normalized to binding levels in the absence of RNA (mock). Results were averaged from five independent experiments. The P values for the observed differences between RNA samples are as follows: 0.007 for Ran25 versus Sel25, 0.0001 for Ran25 versus tRNA, and 0.0301 for Sel25 versus tRNA.

