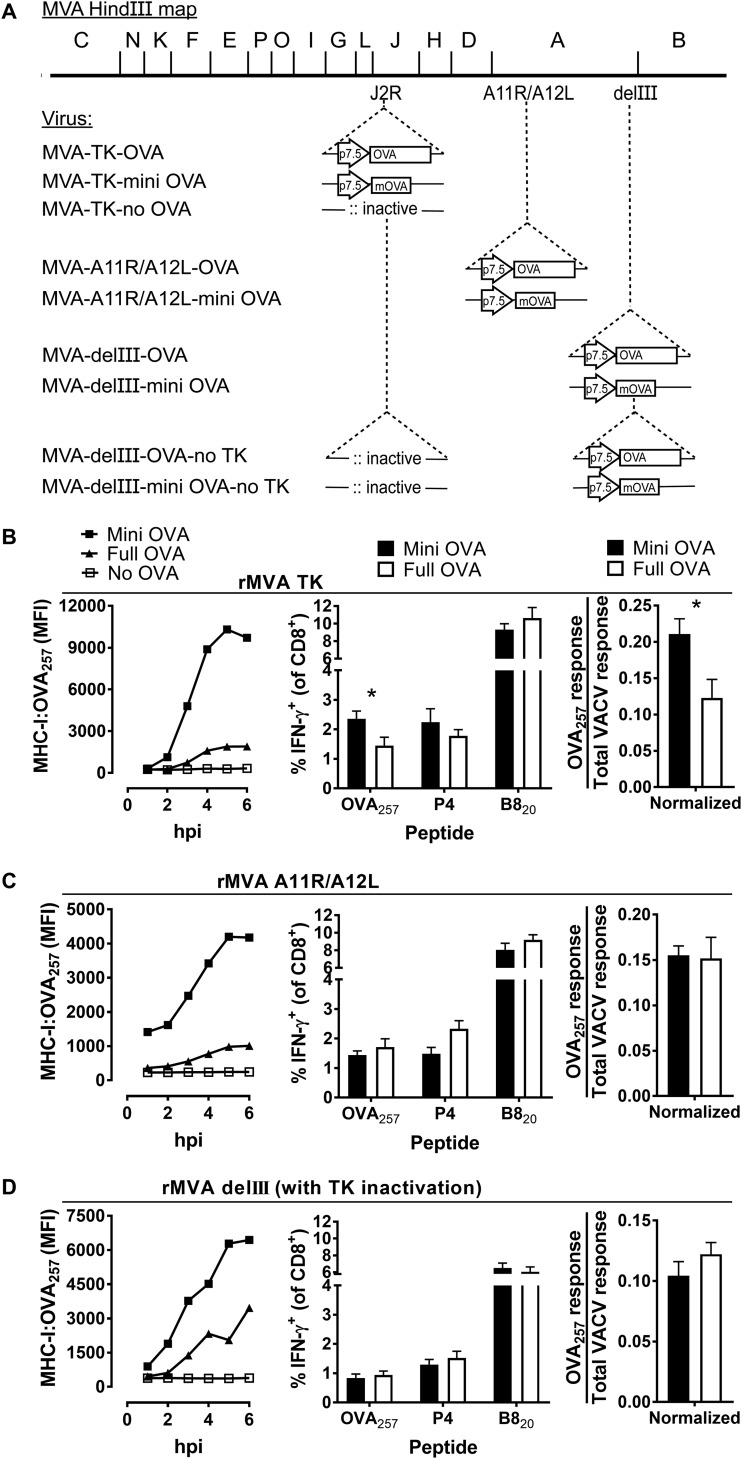
FIG 7.
Presentation to, and priming of, CD8+ T cells by OVA257 expressed in different loci of rMVA and without a functional TK. (A) MVA genome maps showing HindIII fragments and the site of insertion of OVA antigenic constructs and the promoter (arrow). The “m” denotes the minigene (OVA257). (B to D, left) Extent of cell surface presentation of MHC-I:OVA257 complexes on DC2.4 cells infected with viruses. (B to D, middle) Mice were infected with rMVA viruses expressing versions of OVA257 (as shown) and, 7 days later, the responses to peptides were measured. (B to D, right) Using the data shown in the middle graphs, the OVA257-specific response was normalized by dividing by the total VACV-specific response. Means and standard errors of data from at least nine mice combined from three independent experiments are shown (*, P < 0.05).

