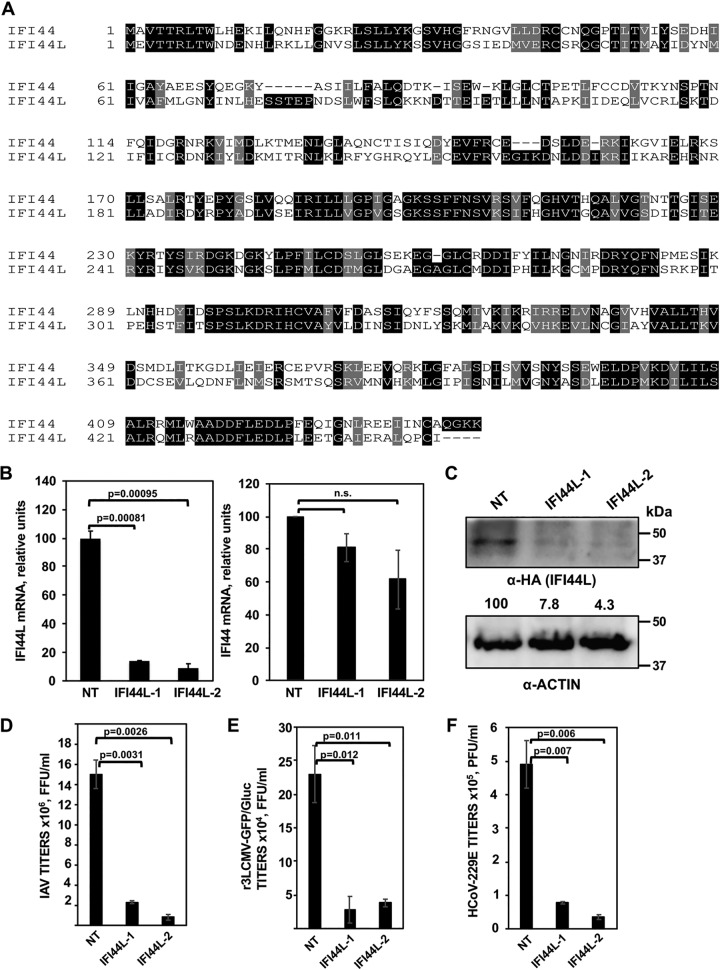
FIG 2.
IFI44L negatively affects virus production. (A) Alignment of the paralog genes IFI44 (top, NCBI reference sequence NP_006408) and IFI44L (bottom, NCBI reference sequence NP_006811). Black boxes indicate the same amino acid in both proteins, and gray boxes indicate residues with similar properties. (B) Downregulation of IFI44L (left) and IFI44 (right) in A549 cells. A549 cells were transfected with two different siRNAs specific for IFI44L or with a nontargeted (NT) siRNA control. At 36 hpt, RNA was extracted and levels of IFI44L and IFI44 mRNAs were evaluated by qPCR. P values determined by using a Student's t test to compare NT-siRNA-silenced cells and IFI44L-siRNA-silenced cells are indicated. n.s., not significant (P > 0.05). (C) At 36 h post-siRNA transfection, cells were transfected with a plasmid expressing IFI44L (pCAGGS-IFI44L-HA) during 48 h. Expression of IFI44L (using an anti-HA tag antibody, top blot) and actin (internal control, bottom) was evaluated by Western blotting. Protein levels were quantified by densitometry using ImageJ software. IFI44L protein expression levels in cells silenced with the NT siRNA were assigned a value of 100% for comparison with the level of expression in IFI44L-silenced cells (numbers below the HA blot). IFI44L expression was normalized to actin expression. Molecular weight markers (in kilodaltons) are indicated on the right. Three different experiments were performed, with similar results. (D to F) Inhibition of viral infections. At 36 h post-siRNA transfection, A549 cells (D and E) were infected with IAV (PR8 strain; MOI, 0.1) (D) or r3LCMV-GFP/Gluc (MOI, 0.1) (E) and virus titers in the cell culture supernatants were evaluated at 48 hpi. Likewise, at 36 h post-siRNA transfection, Huh-7 cells (F) were infected with HCoV-229E (MOI, 0.1) and virus titers were determined at 48 hpi. P values were determined by using a Student's t test to compare NT-siRNA-silenced cells and IFI44L-siRNA-silenced cells. Bars represent standard deviations (SDs) of results from the triplicate wells. P values determined by using a Student's t test to compare NT-siRNA-silenced cells and IFI44L-siRNA-silenced cells are indicated. Three experiments were performed with similar results.

