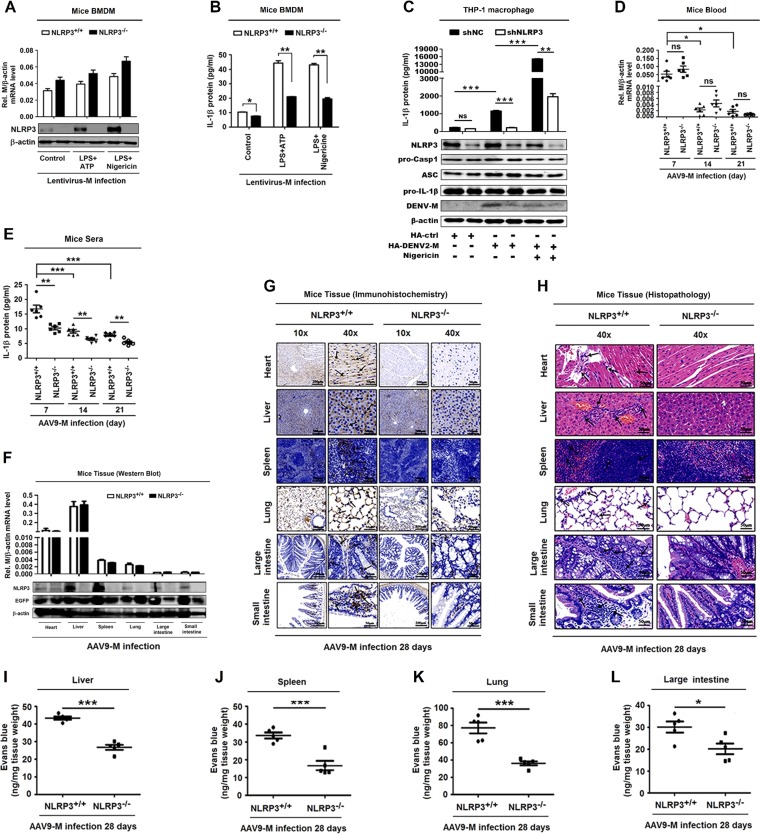
FIG 6.
NLRP3 is crucial for M-induced IL-1β activation and vascular leakage in mice. (A and B) GM-CSF differentiated NLRP3+/+ mouse BMDM cells and NLRP3−/− mouse BMDM cells were infected with M-encoding lentivirus for 48 h and then stimulated with LPS (1 μg/ml) for 6 h and ATP (2.5 mM) for 20 min or nigericin (2 μM) for 2 h. (A) The relative M RNA level was measured by RT-PCR, and NLRP3 and β-actin proteins were determined by Western blotting. (B) IL-1β secreted in cell supernatants was analyzed by ELISA. PMA-differentiated THP-1 macrophages stably expressing short hairpin RNAs (sh-RNAs), sh-NLRP3, and transfected with HA-ctrl or HA-DENV2-M plasmid for 48 h were stimulated with nigericin (2 μM) for 2 h. (C) IL-1β in cell supernatants was measured by ELISA (top) and proteins in cell extract (Lys) were analyzed by WB (bottom). (D and E) NLRP3+/+ C57BL/6 mice (n = 6) or NLRP3−/− C57BL/6 mice (n = 6) received tail vein injections of 300 μl of M-encoding AAV9 (5 × 10¹¹ vg) (AAV9-EGFP-M). Serum was collected every 7 days for AAV9 groups from the orbits. Total RNA was extracted from plasma samples from mice. (D) The RNA level of M protein was quantified by qRT-PCR. (E) IL-1β in the sera was measured by ELISA. Points represent the IL-1β values from each serum sample. At 28 days postinfection, mice were euthanized, and tissues were collected. (F) The levels of M RNA in heart, liver, spleen, lung, large intestine, and small intestine were quantified by qRT-PCR analyses (top), and the levels of NLRP3 protein and EGFP were determined by Western blot analyses (bottom). (G) Immunohistochemistry analysis of IL-1β in the tissues, including heart, liver, spleen, lung, large intestine, and small intestine, after AAV9-EGFP-M infection. Black arrows indicated the immunostaining of IL-1β. (H) Histopathology analysis of tissues, including heart, liver, spleen, lung, large intestine, and small intestine, after AAV9-EGFP-M infection. Black arrows indicate the infiltrated inflammatory cells. At 28 days postinfection, mice were intravenously injected with Evans blue dye. The dye was circulated for 2 h before mice were euthanized, and tissues including liver (I), spleen (J), lung (K), and large intestine (L) were collected. The value of Evans blue was measured at OD610. Data are representative of two independent experiments. Values are means ± SEMs. *, P ≤ 0.05; **, P ≤ 0.01; ***, P ≤ 0.001.

