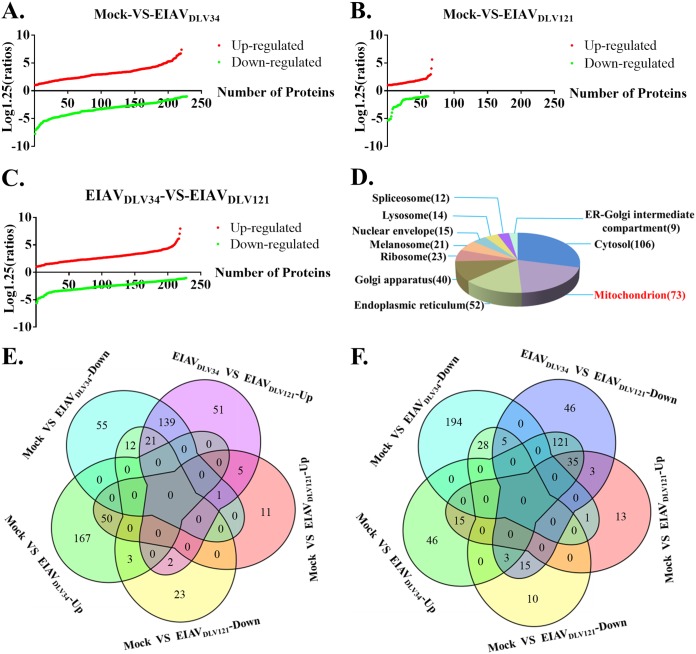
FIG 2.
Comparative proteome analysis of EIAVDLV34-infected cells, EIAVDLV121-infected cells, and uninfected cells obtained through iTRAQ analysis. (A) A cumulative plot of differential protein expression ratios (log1.25 ratio) and the quantity of differentially expressed proteins between mock- and EIAVDLV34-infected cells. In total, there were 220 upregulated proteins with ratios of between 1.261 and 5.2 and 228 downregulated proteins with ratios of between 0.178 and 0.798. (B and C) The cumulative plots are similar to those in panel A, but the comparison groups are mock- versus EIAVDLV121-infected cells (B) and EIAVDLV34- versus EIAVDLV121-infected cells (C). In the mock- versus EIAVDLV121-infected comparison group, there were 67 upregulated proteins with ratios of between 1.252 and 3.508 and 61 downregulated proteins with ratios of between 0.305 and 0.799. In the EIAVDLV34- versus EIAVDLV121-infected comparison group, there were 219 upregulated proteins with ratios of between 1.256 and 5.935 and 228 downregulated proteins with ratios of between 0.284 and 0.793. (D) A pie chart of enriched GO-CC terms in the EIAVDLV34- versus EIAVDLV121-infected comparison group (P < 0.05). The areas with different colors represent different terms. ER, endoplasmic reticulum. (E) Venn diagram showing upregulated proteins from the EIAVDLV34- versus EIAVDLV121-infected comparison group with both upregulated and downregulated proteins from the mock- versus EIAVDLV34-infected and mock- versus EIAVDLV121-infected comparison groups. (F) Venn diagram showing downregulated proteins from the EIAVDLV34- versus EIAVDLV121-infected comparison group with both upregulated and downregulated proteins from the mock- versus EIAVDLV34-infected and mock- versus EIAVDLV121-infected comparison groups.

