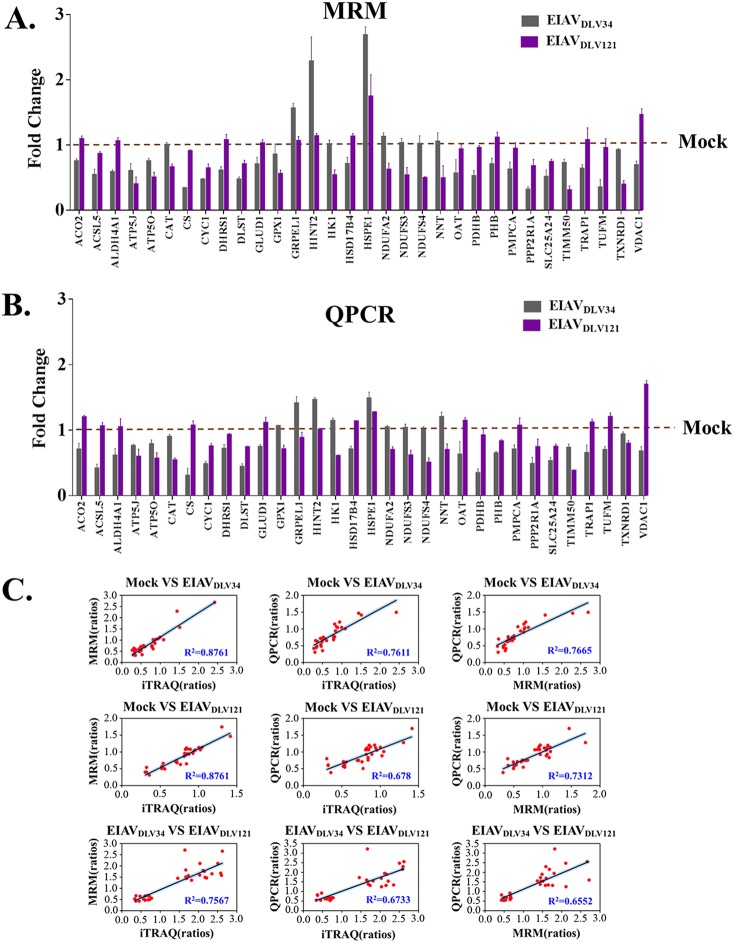
FIG 3.
MRM and qPCR verification of proteins determined by iTRAQ to be differentially expressed. (A) Alteration of the level of translation of 32 selected mitochondrial genes in eMDMs following EIAVDLV34 and EIAVDLV121 infection was examined at 3 dpi by quantitative analysis of the corresponding protein expression levels in cells infected with either EIAVDLV34 or EIAVDLV121 or in mock-infected cells. Total protein was extracted from eMDMs and reduced, alkylated, and digested with trypsin for subsequent analysis via MRM. Fold change values were calculated by using β-galactosidase for data normalization. Error bars represent the standard error from three independent experiments. (B) Alteration of the levels of transcription of 32 selected mitochondrial genes in eMDMs following EIAVDLV34 and EIAVDLV121 infection was examined by quantitative analysis of the corresponding mRNA expression levels at 3 dpi in cells infected with either EIAVDLV34 or EIAVDLV121 or mock-infected cells. Total RNA was extracted from eMDMs and reverse transcribed into cDNA for subsequent analysis via qPCR. Fold change values were calculated according to the 2−ΔΔCT method using β-actin as an internal reference gene. Error bars represent the standard error from three independent experiments. (C) Linear regression analysis of fold change ratios among iTRAQ, MRM, and qPCR in the mock- versus EIAVDLV34-infected, mock- versus EIAVDLV121-infected, and EIAVDLV34- versus EIAVDLV121-infected comparison groups. Red dots represent fold change ratios of a single gene obtained from iTRAQ and MRM analyses, iTRAQ and qPCR analyses, or MRM and qPCR analyses. R2, correlation coefficient.

