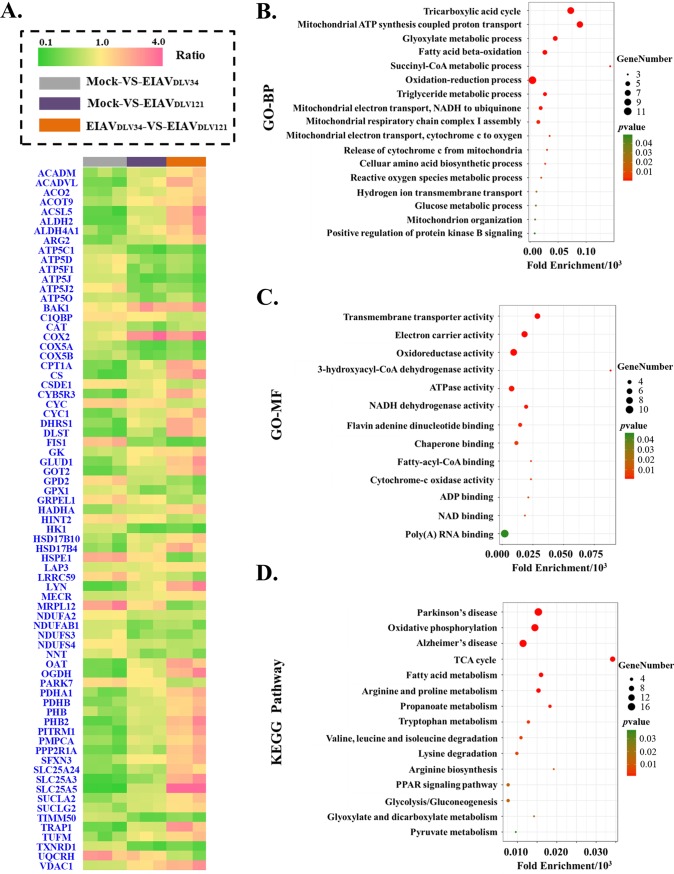
FIG 4.
GO and KEGG pathway enrichment results of differentially expressed mitochondrial proteins. (A) The fold change ratios of differentially expressed mitochondrial proteins are depicted as a heat map. The different comparison groups are highlighted along the bottom of the heat map and include the mock- versus EIAVDLV34-infected (gray), mock- versus EIAVDLV121-infected (purple), and EIAVDLV34- versus EIAVDLV121-infected (orange) comparison groups. Every comparison group contained three biological replicates. Each horizontal line represents a protein of one biological replicate, and the color (green, low fold change ratios; yellow, no change; pink, high fold change ratios) represents the scaled ratios. (B) Analysis of GO biological processes (GO-BP) in the bubble chart; (C) analysis of GO molecular functions (GO-MF) in the bubble chart; (D) KEGG pathway enrichment analysis in the bubble chart. P values (i.e., EASE scores) were calculated using a Benjamini-corrected modified Fisher’s exact test. EASE scores of <0.05 indicate statistical significance. Fold enrichment gives a measure of the magnitude of enrichment, and fold enrichments of 1.5 and above were considered interesting. PPAR, peroxisome proliferator-activated receptor.

