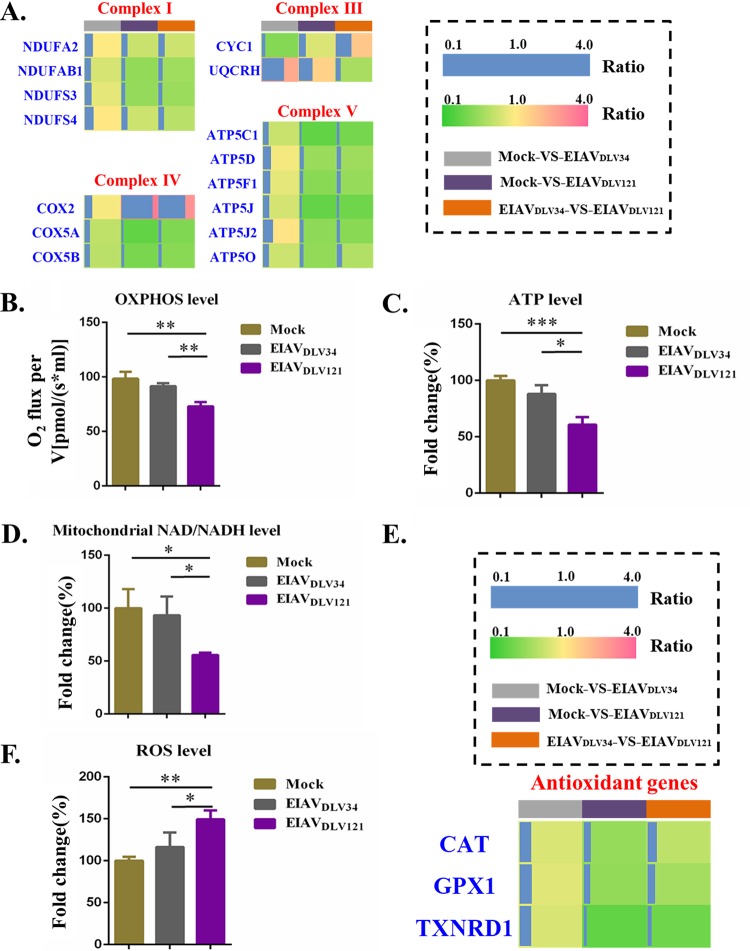
FIG 5.
Assay of changes in mitochondrial OXPHOS and ROS in eMDMs after EIAVDLV34 or EIAVDLV121 infection. (A) The fold change ratios of differentially expressed proteins from mitochondrial respiratory complexes are depicted as a heat map. The different comparison groups are highlighted along the bottom of the heat map and include the mock- versus EIAVDLV34-infected (gray), mock- versus EIAVDLV121-infected (purple), and EIAVDLV34- versus EIAVDLV121-infected (orange) comparison groups. Each horizontal line represents the mean ratio for three biological replicates of one protein, and the color (green, low fold change ratios; yellow, no change; pink, high fold change ratios) represents the scaled ratios. The length of the blue line also represents the scaled ratios. (B to D) Assays of mitochondrial OXPHOS, ATP, and NAD/NADH levels in eMDMs infected with either EIAVDLV34 or EIAVDLV121 or mock-infected eMDMs. V, unit volume. (E) The fold change ratios of the differentially expressed proteins from the antioxidant system are depicted in a heat map similar to that shown in panel A. (F) Assays of mitochondrial ROS levels in eMDMs infected with either EIAVDLV34 or EIAVDLV121 or mock-infected eMDMs. Significant differences between the different groups were determined using Student's t test. *, P < 0.05; **, P < 0.01; ***, P < 0.001. Error bars represent the standard error from three independent experiments.

