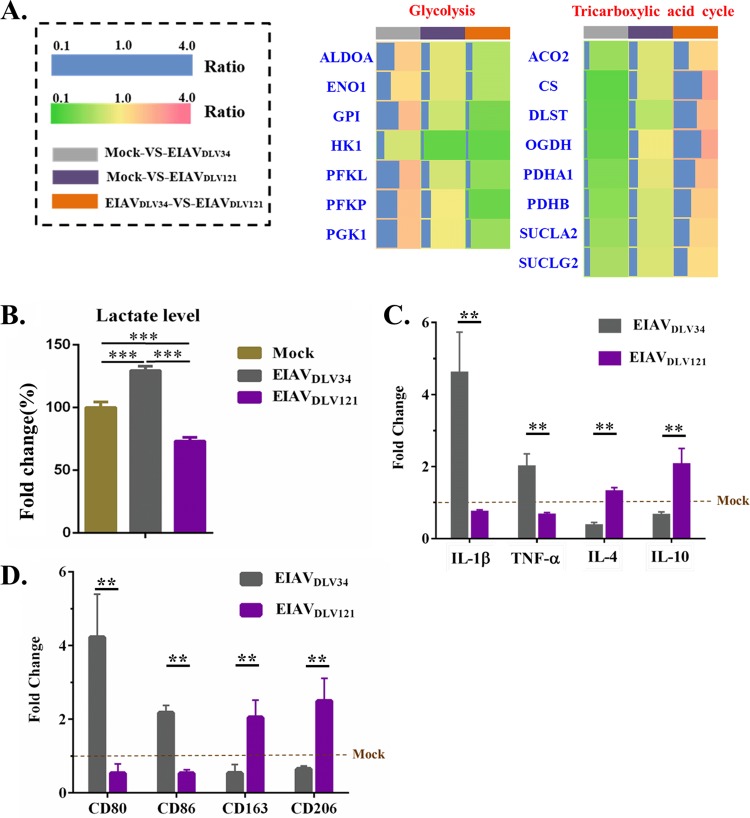
FIG 7.
Metabolic patterns in eMDMs following infection with EIAVDLV34 or EIAVDLV121. (A) The fold change ratios of differentially expressed proteins involved in the TCA cycle and glycolysis are depicted in a heat map similar to that shown in Fig. 5A. (B) Assay of lactate levels in eMDMs infected with EIAVDLV34 or EIAVDLV121 or mock-infected eMDMs. (C) Alteration of the levels of transcription of proinflammatory cytokines (IL-1β and TNF-α) and anti-inflammatory cytokines (IL-4 and IL-10) in eMDMs following EIAVDLV34 and EIAVDLV121 infection was examined by qPCR analysis of the corresponding mRNA expression levels at 3 dpi in cells infected with either EIAVDLV34 or EIAVDLV121 or mock-infected cells. The qPCR method used here is similar to that described in the legend to Fig. 3B. (D) Alteration of the levels of transcription of M1 phenotypic markers (CD80 and CD86) and M2 phenotypic markers (CD163 and CD206) in eMDMs following EIAVDLV34 and EIAVDLV121 infection was examined by qPCR analysis of the corresponding mRNA expression levels at 3 dpi in cells infected with either EIAVDLV34 or EIAVDLV121 or mock-infected cells. The qPCR method used here is similar to that described in the legend to Fig. 3B. Significant differences between the different groups were determined using Student's t test. **, P < 0.01; ***, P < 0.001. Error bars represent the standard error from three independent experiments.

