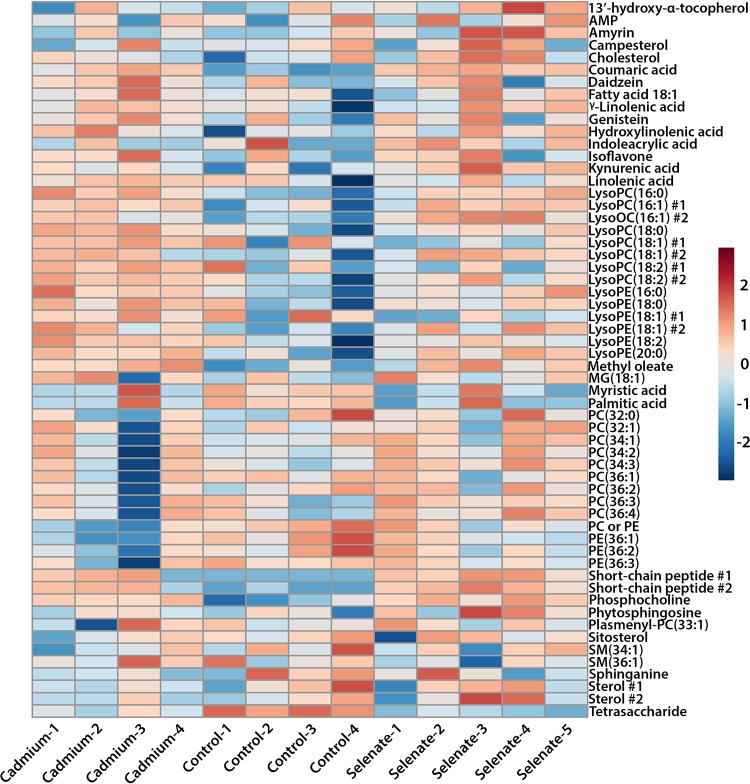
FIG 6.
Heat map of bee metabolomes separated by individual sample and metabolite for identified metabolites in control-, selenate-, and cadmium-treated bees. Heat color corresponds to the autoscaled Euclidean distance between samples. LysoPC, lysophosphatidylcholine; LysoPE, lysophosphatidylethanolamine; MG, monoacylglycerol; PC, phosphatidylcholine; PE, phosphatidylethanolamine; SM, sphingomyelin. Number signs (#) denote similarly identified compounds that had distinct m/z values.

