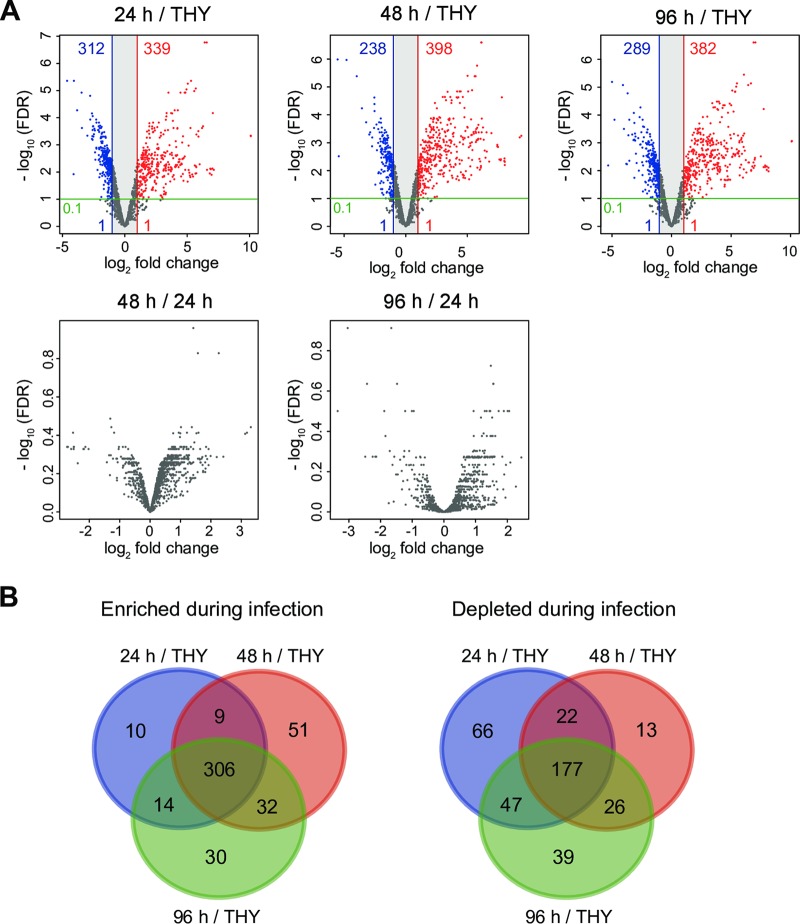
FIG 3.
Differentially expressed genes showing consistent alteration in hindlimbs at each infection phase. (A) Volcano plots show gene expression differences under the comparison conditions indicated in each figure. Colored circles indicate significantly upregulated (red) and downregulated (blue) genes (absolute log2 fold change, >1; adjusted P < 0.1). (B) Three-way Venn diagram illustrating bacterial genes consistently altered during infection relative to the THY condition (24 h versus THY, 48 h versus THY, and 96 h versus THY). The findings showed that 306 transcripts were consistently enriched in vivo (log2 fold change, >1; adjusted P < 0.1), and 177 transcripts were consistently downregulated in vivo (log2 fold change, <−1; adjusted P < 0.1).

