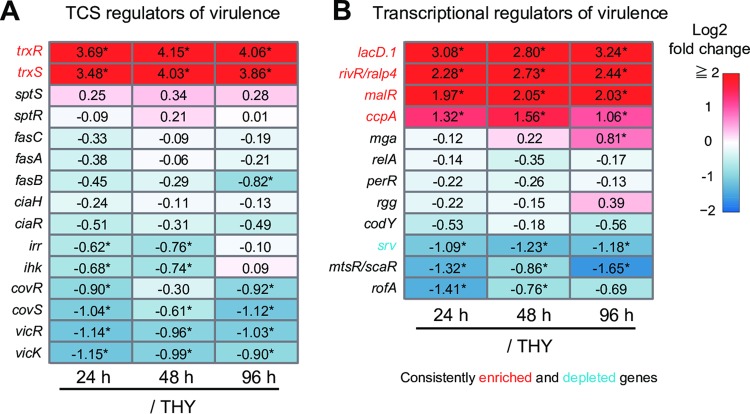
FIG 7.
Expression levels of genes encoding virulence-related transcriptional regulators. (A and B) Two-component signal transduction systems (TCSs) (A) and transcriptional regulators of virulence (B). Log2 fold changes of the 24-h (left), 48-h (center), and 96-h (right) groups with respect to the THY group are indicated in color scale boxes. Numbers in the frame represent measured log2 fold change values. Color scale indicates enrichment (red) and depletion (blue) during infection. An asterisk indicates significant difference: *, P < 0.1.

