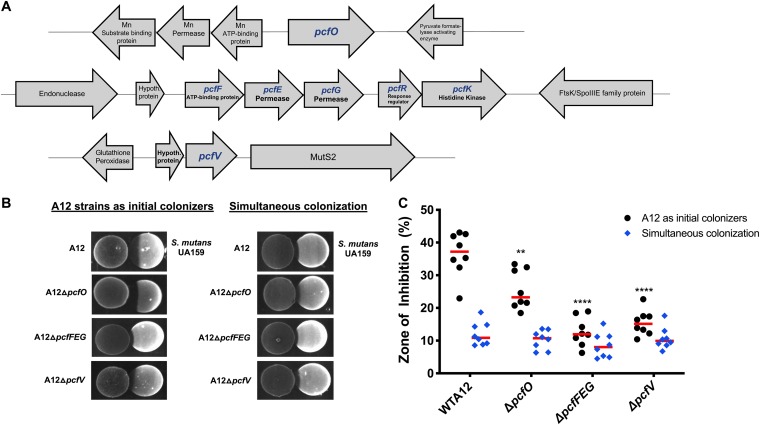
FIG 1.
(A) Schematic diagram of loci encoding potential competitive factors (pcf genes) of A12. pcf genes are indicated in blue, and illustrated are gene order and the arrangement of neighboring genes. (B) Plate-based growth inhibition of A12 strains versus S. mutans. Bacterial cultures were grown overnight in BHI medium and adjusted to an OD600 of 0.5 with sterile BHI. Aliquots (6 μl) from each culture were spotted adjacent to the other strain on BHI agar plates whether simultaneously (right) or A12 or A12 mutant derivatives first followed by spotting of S. mutans 24 h later (left). Plates were incubated for 24 h or 48 h, respectively, at 37°C in a 5% CO2 aerobic atmosphere. Representative images are shown. (C) Zones of inhibition were captured with a digital imager and measured with NIH ImageJ analysis, which was set to a standardized scale (10.234 pixels per mm). The area that would have been occupied by an intact colony of S. mutans was measured in the same way. Then the area of growth inhibition was divided by the total area of the expected colony in square millimeters and multiplied by 100 to determine the percentage of inhibition (y axis) elicited by A12 and its derivatives. Values are the averages of two biological replicates, performed in technical quadruplicates. Red bars indicate the sample medians. Asterisks indicate statistically significant differences compared to the zone of inhibition created by wild-type A12. Statistical analysis was performed using an unpaired Student t test. **, P < 0.01; ****, P < 0.0001.

