Fig. 2.
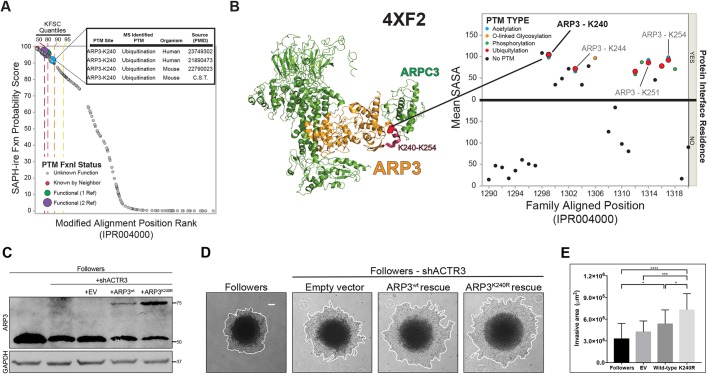
PTM hotspot analysis of ARP3 K240 suggests that the K240R mutation has a functional impact. (A) Plot of SAPH-ire probability score by rank for all modified alignment positions in the ARP protein family IPR004000. The ARP3 K240 ubiquitylation site is highly ranked along with other MAPs that contain PTMs with well-established function (four or more supporting references), as indicated by known function source count (KFSC) quantiles. Inset, table of ARP3 K240 PTMs identified by mass spectrometry of human and mouse tissues, including literature sources. (B) Local PTM topology of the ARP3 family near ARP3 K240. PTM sites plotted by solvent accessible surface area (SASA) and proximity to the interface of a protein–protein interaction. Human ARP3 PTMs are labeled, revealing multiple ubiquitylation sites between K240 and K254. Left, structure of the Arp2/3 complex (PDB 4XF2) indicating ARP3 K240 (spheres) within the K240–K254 region of ARP3 (red). (C) Western blot showing exogenous (upper band) versus endogenous (lower band) ARP3 expression in unmodified followers, and shACTR3-expressing followers rescued with either empty vector (EV), wild-type ARP3 (ARP3wt), or ARP3K240R. Rescue constructs were mCherry-tagged to allow for visualization within invasive chains. (D) Images of invasion in Matrigel at 24 h of spheroids comprised of unmodified follower cells, or shACTR3-expressing followers transfected with either empty vector, wild-type ARP3, or ARP3 K240R constructs. The edge of the spheroid is highlight by a white line. (E) Quantification of spheroid invasive area (mean±s.d., n=17, 15, 16, and 17 spheroids per group, respectively, across N=3 experiments). *P<0.05, ***P<0.001, ****P<0.0001 (one-way ANOVA with Tukey's post-test). Scale bar: 100 µm.

