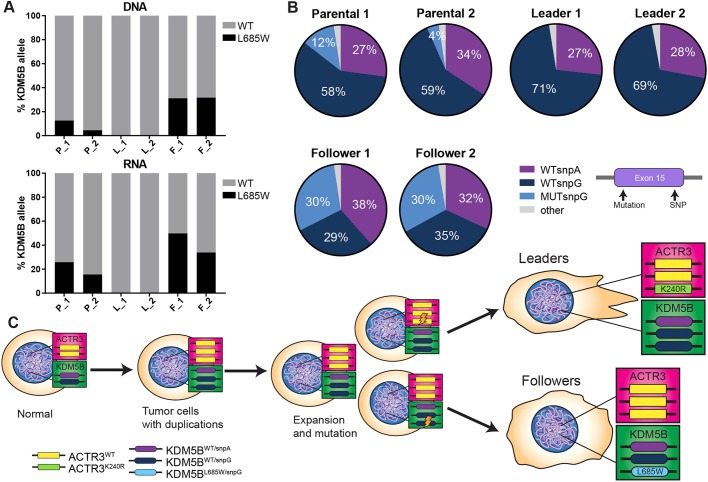
Fig. 6.
Leader and follower cells are derived from two separate populations defined by mutational profile. (A) Deep targeted resequencing across KDM5B exon 15 in genomic DNA (top) and RNA (bottom) isolated from parental, leader and follower populations (N=2 independent isolates of DNA or RNA at separate passages of cells derived from a single phenotypic isolation; average depth=348,327 reads per sample). (B) Pie charts depicting proportions of KDM5B genotypes across parental, leader and follower populations as determined from the deep amplicon sequencing shown in A. (C) Model of the potential history of leader and follower populations from parental cell population as inferred from the genetic profiles of KDM5B and ARP3.

