Fig. 1.
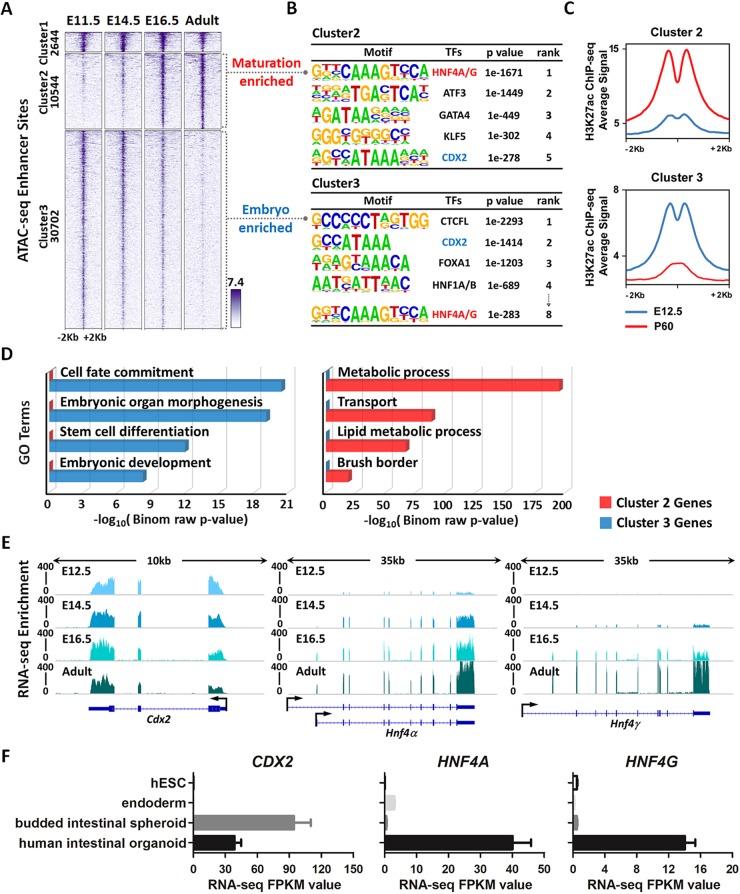
Chromatin landscapes indicate that HNF4 factors function in maturation of the developing gut. (A) ATAC-seq (GSE115541, n=2 biological replicates per timepoint; isolated embryonic epithelium was collected from the entire small intestine) data defined regions of accessible chromatin across indicated stages of mouse intestinal epithelium development (MACS P value ≤10−5). K-means clustering analysis reveals a shift in accessible enhancer chromatin of intestinal epithelial cells across developmental time. (B) HOMER de novo DNA-motif enrichment analysis of ATAC-seq regions (MACS P value ≤10−5) shows that CDX2 binding sequences are more prevalent in accessible regions of the early embryonic state (embryo-enriched, cluster 3), whereas HNF4 binding sequences are more prevalent in accessible regions of the fetal and adult states (maturation-enriched, cluster 2). (C) H3K27ac ChIP-seq (GSE89684, n=2 biological replicates per timepoint) profiles demonstrate that the active chromatin marker is enriched in a stage-specific manner, corresponding to embryo-specific or P60 adult-specific accessible regions. (D) GREAT GO term analysis shows distinct gene ontologies of target genes linked to stage-specific ATAC-seq sites within 20 kb. (E) RNA-seq of purified epithelium (GSE115541, n=2 biological replicates per timepoint; isolated embryonic epithelium was collected from the entire small intestine) shows that Cdx2 is highly and equally expressed across developmental time, whereas Hnf4a and Hnf4g are not robustly expressed until E14.5 and E16.5, respectively. (F) RNA-seq (E-MTAB-4168) shows that CDX2 expression is induced when human endoderm is specified to intestine by treatment with FGF4 (500 ng/ml) and CHIR99021 (2 µM; WNT agonist). By contrast, HNF4A/G expression is not induced until human intestinal organoids are formed by subsequent differentiation steps. See schematic in Fig. S1D for details on human intestinal organoid differentiation conditions. Data are presented as mean±s.e.m. At least three biological replicates are included per stage, and samples from the same stage are grouped and presented.

