Fig. 2.
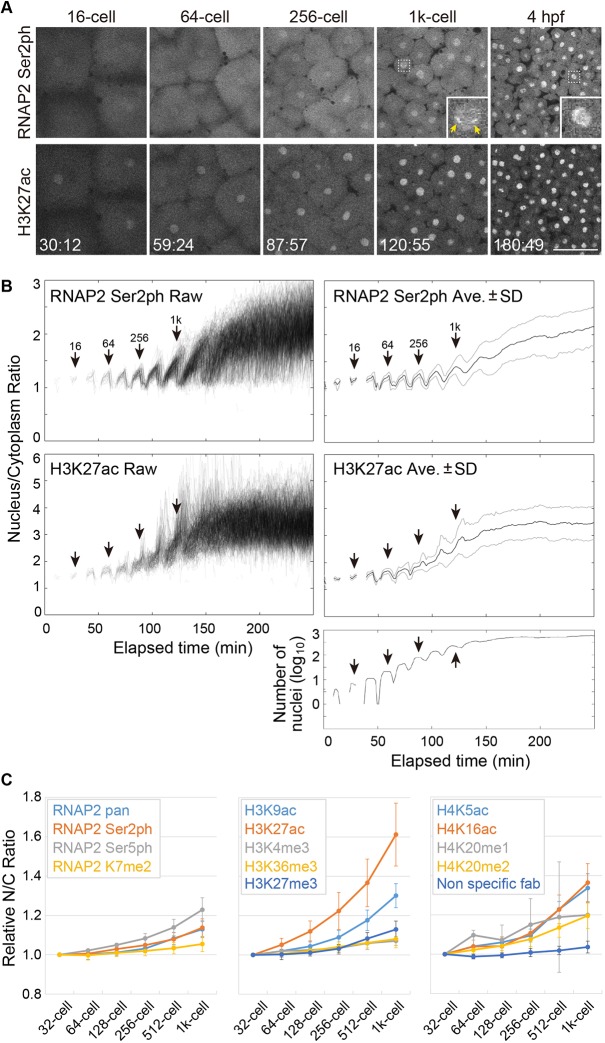
Changes in the nuclear enrichments of Fabs specific to RNAP2 Ser2ph and H3K27ac during zebrafish embryo development. (A) Representative images of embryos injected with Fabs specific for RNAP2 Ser2ph (Alexa 488), H3K27ac (Cy3) and H3K9ac (Cy5). Single confocal sections for RNAP2 Ser2ph and H3K27ac are shown. Insets show magnified views of the indicated areas. Yellow arrows indicate RNAP2 Ser2ph foci in nuclei. Elapsed times (min:s) are indicated. See also Movie 3. Scale bar: 100 μm. (B) Nucleus/cytoplasm intensity ratios. Stages judged from time-lapse images are indicated. A graph representing the number of measured nuclei is shown at the bottom. The global level of H3K27ac in nuclei increased slightly earlier than that of RNAP2 Ser2ph. (C) Changes in the nuclear enrichments of Fabs specific for various RNAP2 and histone modifications. Relative nucleus/cytoplasm (N/C) intensity ratios, relative to those of the 32-cell stage, are shown for various modifications and a control (mean±s.d. of 3 embryos).

