Fig. 1.
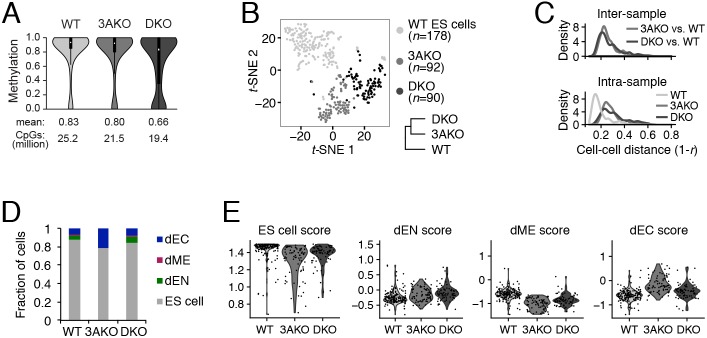
Increased cellular variation in DNMT3A and DNMT3A/3B knockout ES cells. (A) Violin plot of CpG methylation for wild-type (WT), DNMT3A−/− (3AKO) and DNMT3A/3B−/− (DKO) cells averaged across two replicates. Mean methylation level and number of CpGs per sample are shown at the bottom and black boxes within the violin plots represent the interquartile range. Data were obtained from Liao et al. (2015) and are available at GEO under accession number GSE63281. (B) Dimensionality reduction of WT, 3AKO and DKO single ES cells (dots) using t-distributed stochastic neighbor embedding (t-SNE) and hierarchical clustering (bottom right) of the averaged expression profiles for sorted ES cells from each cell line. Samples 3AKO and DKO were more similar to each other than to WT ES cells. (C) Inter-sample (top) and intra-sample (bottom) density distribution of all pairwise cell-cell distances for WT, 3AKO and DKO cells. (D) Fraction of WT, 3AKO and DKO cells classified into four categories: ES cell; endoderm (dEN); mesoderm (dME); and ectoderm (dEC). (E) Violin plots of ES cell, dEN, dME and dEC scores for WT, 3AKO and DKO samples: each dot represents an in silico-sorted undifferentiated cell.

