Fig. 2.
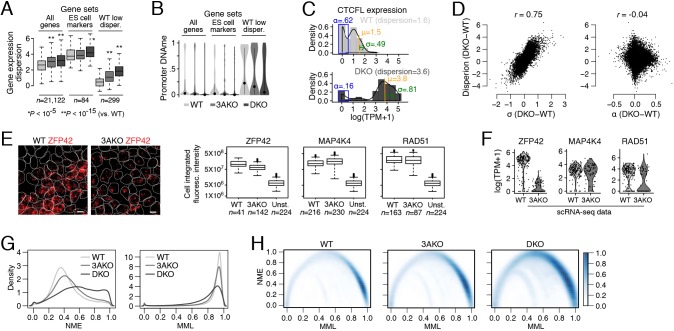
Relationship between DNA methylation level, mean methylation entropy and transcript variation in DNMT3A and DNMT3A/3B knockouts. (A) Box plots of gene expression dispersion distribution, log(variance/mean), for all genes, ES cell markers and WT low dispersion genes for WT, 3AKO and DKO ES cells. (B) Violin plots of promoter mean CpG methylation for all genes, ES cell markers and WT low dispersion genes from WT, 3AKO and DKO ES cell bulk samples, averaged across two replicates. Dots represent the mean and lines extend at most one standard deviation from the mean. (C) Histograms of CTCFL expression in WT (top) and DKO (bottom) cells binned at intervals of 0.5 log(TPM+1) expression levels and normalized to the total cell counts. The three parameters that are estimated for CTCFL gene expression distribution (α, μ and σ) are shown in blue, orange and green, respectively. Dispersion for CTCFL increases and coincides with an increase in σ and μ as well as a decrease in α. (D) Scatter plots of the difference in dispersion, log(variance/mean) and parameters σ (left) and α (right) in DKO versus WT cells. We observe a high correlation between dispersion and σ difference (r=0.75) but not between dispersion and α difference (r=−0.04). (E) Left: representative images of RNA FISH with probes targeting ZFP42 (red) in WT (left) and 3AKO (right) ES cells. Cell segmentation is shown using white outlines. Scale bars: 10 μm. Right: box plots of ZFP42 (left), MAP4K4 (middle) and RAD51 (right) integrated probe intensity summed over the volume of the cell for WT, 3AKO and unstained (Unst.) ES cells. (F) Violin plots of log(TPM+1) gene expression for ZFP42 (left), MAP4K4 (middle) and RAD51 (right) in WT and 3AKO ES cell scRNA-seq data show similar trends in transcript variation as the RNA FISH experiment for these three genes. (G) Normalized methylation entropy (NME; left) and mean methylation level (MML; right) measured using WT, 3AKO and DKO ES cell whole genome bisulfite sequencing data across all chromosome 21 and 22 CpGs using the approach in Jenkinson et al. (2017). (H) Smoothed scatter plot with color intensity showing density of all chromosome 21 and 22 CpGs NME versus MML data. For WT, most CpGs have high MML and low NME (dark blue, bottom right). DKO CpGs with high NME spread across a lower MML (middle top of DKO plot; intensity gets darker), consistent with the global loss of methylation in the DKO sample. Box plots: boxes display the interquartile range, horizontal line within the box shows the median, whiskers extend to the most extreme data point that is no more than 1.5 times the length of the interquartile range.

