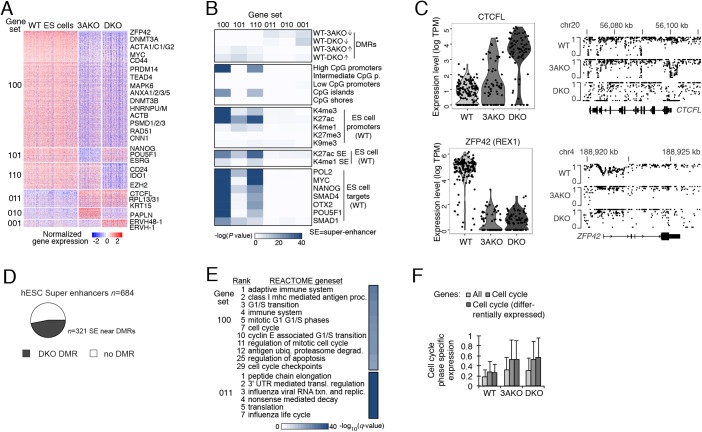
Fig. 3.
Global transcriptional repression and altered regulation in DNMT3A and DNMT3A/3B knockout ES cells. (A) Differentially expressed genes (right; rows) for sorted populations of WT, 3AKO and DKO ES cells (columns). Genes are separated into six gene sets [left: 100 (n=1443), 101 (n=191), 110 (n=330), 011 (n=229), 010 (n=143) and 001 (n=98)], where 1 or 0 indicates high or low expression for the respective condition (order: WT, 3AKO, DKO). (B) Genomic enrichment analysis for gene sets (columns) defined in panel A against CpG density features, epigenetic and TF binding data collected in matching WT ES cells (Gifford et al., 2013; Tsankov et al., 2015b). (C) Top: distribution (dots indicate individual cells) of CTCFL expression (left) and the corresponding CpG methylation levels at the CTCFL locus for WT, 3AKO and DKO ES cells. Bottom: ZFP42 cellular expression (left) and promoter methylation (right) as described above. (D) Of all 684 H1 ES cell super-enhancers (Hnisz et al., 2013), 321 (47%) are located within 1 kb of a DKO DMR (displayed in black). In total, 734 DKO DMRs (of 44,244 total) were associated with super-enhancers, and are defined as regions with difference in methylation>0.6 relative to WT, with P<0.01 (F-test). (E) Functional enrichment analysis for the gene sets defined in panel A against the REACTOME database. (F) Distribution of cell cycle phase-specific expression for sorted WT, 3AKO and DKO ES cells considering all genes, cell cycle annotated genes and differentially expressed cell cycle annotated genes. Error bars indicate one standard deviation. DMR, differentially methylated region; K, lysine on histone 3; me3, tri-methylation; ac, acetylation; me1, mono-methylation.

