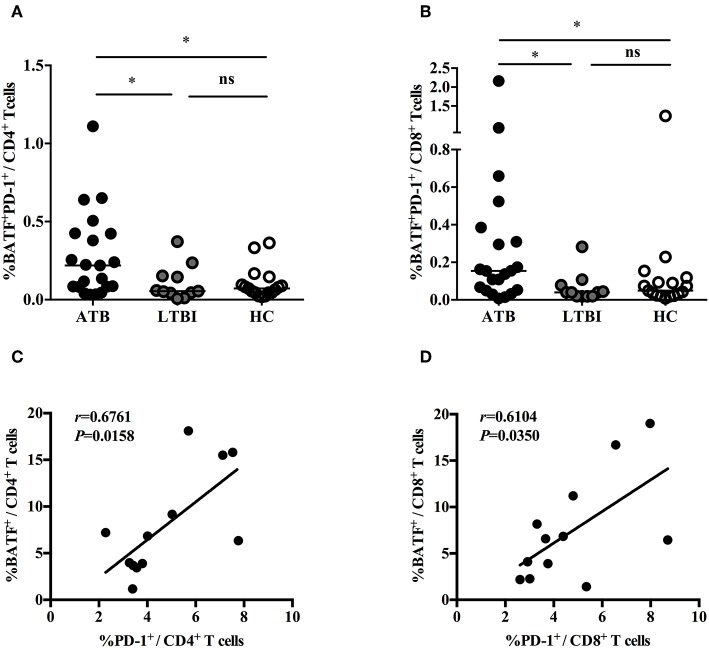
Figure 2.
The correlations between PD-1 expression and BATF expression in T cells. (A) Expression of BATF in the peripheral blood PD-1-expressing CD4+ T cells of ATB group, LTBI group, and HC group. The horizontal lines represent the medians for each group. (B) Expression of BATF in the peripheral blood PD-1-expressing CD8+ T cells of ATB group, LTBI group, and HC group. The horizontal lines represent the medians for each group. (C) Correlation analysis between the expression of BATF and PD-1 in CD4+ T cells among ATB individuals. (D) Correlation analysis between the expression of BATF and PD-1 in CD8+ T cells among ATB individuals. *P < 0.05. ATB, active tuberculosis; LTBI, latent tuberculosis infection; HC, healthy control; ns, not significant.

