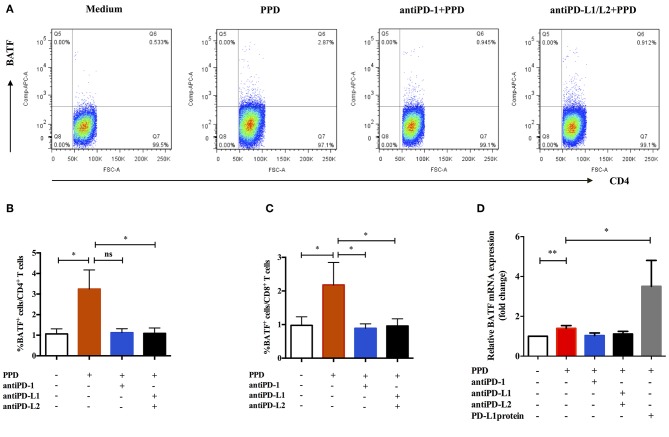
Figure 3.
Expression of BATF was influenced by PD-1/PD-Ls pathway in patients with ATB. (A) Representative CD4-gated dot plots of BATF expression after blockade of PD-1/PD-Ls pathway. (B) BATF expressions in CD4+ T cells measured by flow cytometry after blockade of PD-1 or PD-L1/L2 (n = 9). (C) BATF expressions in CD8+ T cells measured by flow cytometry after blockade of PD-1 or PD-L1/L2 (n = 9). (D) Relative BATF mRNA expressions in PBMCs measured by real-time quantitative PCR after blockade of PD-1 or PD-L1/L2 or activation of PD-L1 (n = 11). Data are expressed as mean ± SEM. *P < 0.05, **P < 0.01.

