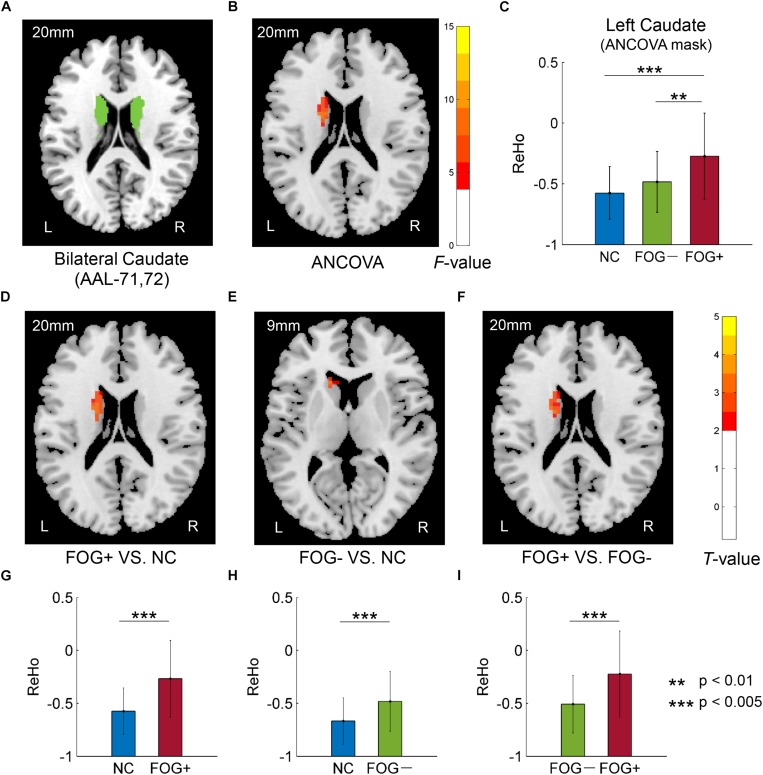
FIGURE 3.
Regional homogeneity differences among NC, FOG–, and FOG+ within the bilateral caudate. (A) Bilateral caudate. (B) F-map of ANCOVA analysis of the three groups, corrected by GRF with voxel p < 0.05, threshold of F > 3.84 and cluster size >1566 mm3. (C) FOG+ subjects showed higher ReHo within the left caudate than did FOG– and NC. Post hoc two-sample t-tests on FOG+ and NC (D,G), FOG– and NC (E,H), and FOG+ and FOG– (F,I). The T-map in (E) was with a threshold of an uncorrected voxel p < 0.05, (D,F) were corrected by GRF with voxel p < 0.05, threshold of T > 2.00 and cluster size >486 mm3. L/R, eft/right hemisphere; NC, normal controls; FOG+/FOG–, Parkinson’s disease with/without freezing of gait.

