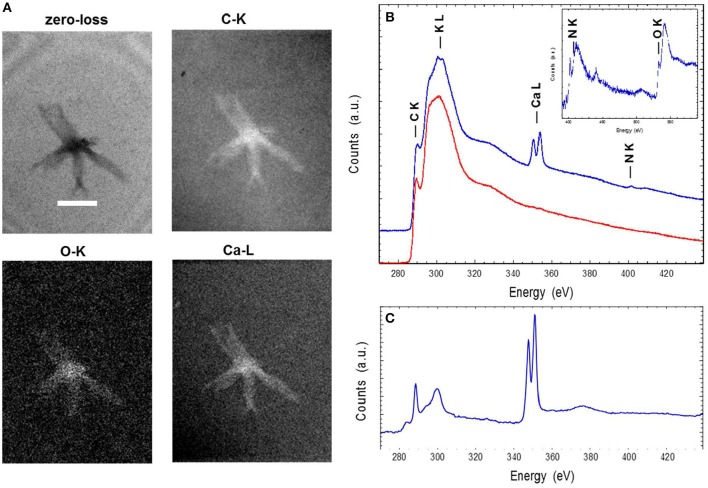
Figure 4.
Energy-filtered transmission electron microscopy (EFTEM) (A) and electron energy loss spectroscopy (EELS) analyses (B,C) of aster-like nanoparticles (ALNs). (A) Zero-loss image and EFTEM C, O, and Ca maps of an ALN. Scale bar=200 nm. (B) EELS spectra of an ALN particle (blue) and formvar (red). Insert: close-up of the background-normalized spectrum of an ALN particle at the N and O K-edges. (C) EELS spectra of a reference calcite crystal at the C K-edge and the Ca L2,3-edges. The relative intensities at the C K-edge and Ca L2,3 edges correlate with C/Ca atomic ratio.

