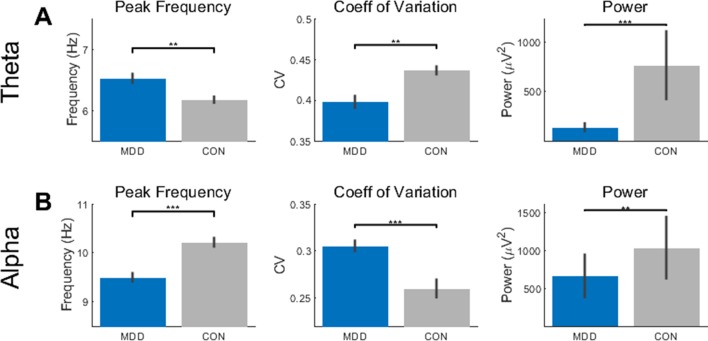
Figure 1.
Resting state activity showed differences in theta and alpha between the MDD group and healthy controls. (A) The peak frequency (PF), coefficient of variation (CV), and power measures showed higher PF, lower CV, and lower power in the MDD participants than the controls. (B) In the alpha band, the MDD group had lower PF, higher CV, and lower power. All p-values are FDR corrected for multiple comparisons. **: < 0.01, ***: <0.001.

