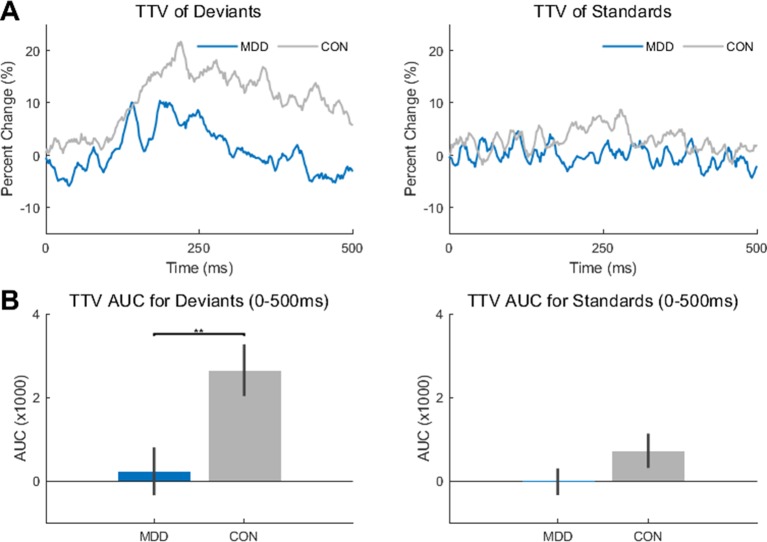
Figure 2.
Trial-to-trial variability (TTV) showed significantly less change in variability in the MDD group for deviant stimuli. (A) TTV curves (80 trials) in both groups for deviant and standard stimuli. (B) Area under the curve (AUC) was measured between 0-500ms for both groups and stimuli. The AUC in the MDD group was significantly lower in the deviant stimuli compared to the healthy controls. All p-values are FDR corrected for multiple comparisons. **: < 0.01.

