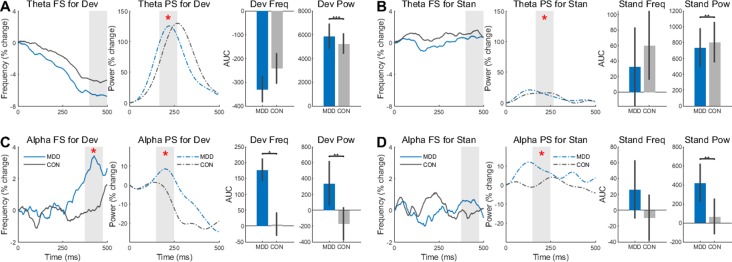
Figure 4.
Frequency Sliding (FS) and Power Sliding (PS) found greater changes to deviant stimuli in the MDD group for theta and alpha frequency bands. (A) In the deviant stimuli, Theta PS was higher in the MDD group and lower (B) for standard stimuli. (C) In the alpha band, both FS and PS were significantly higher for the deviant stimuli in the MDD group. (D) Only the PS was higher in the MDD group for standard stimuli in the alpha band. Area under the curve for 100ms time intervals were measured. Time intervals are shown with grey shading. All p-values are FDR corrected for multiple comparisons. *: < 0.05, **: < 0.01, ***: <0.001.

