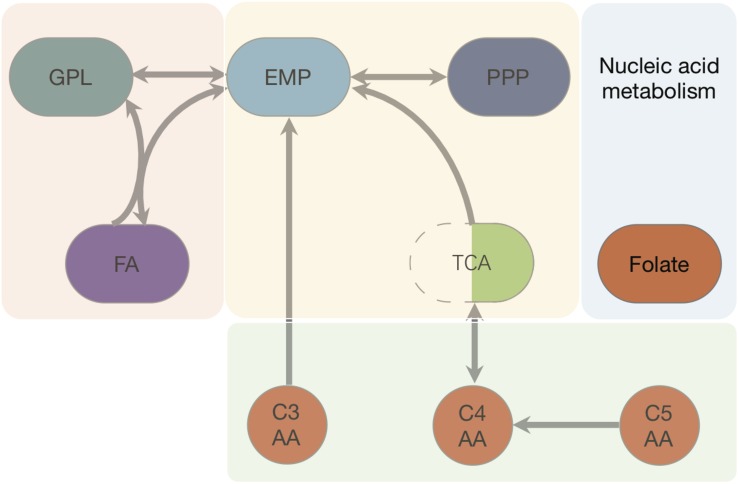
FIGURE 2.
Pathways and fluxes in Ct. Sink and source metabolites are shown, the different pathways present in Ct are given as complete and incomplete lines. Approximate flux strength are indicated. The pathway with the strongest flux is shown as blue thick line (path from pyruvate → acetyl–CoA → malonyl–CoA = malonyl–ACP). A detailed vector graphic is given in supplement, showing all internal and external metabolites and flux strengths quantitatively.

