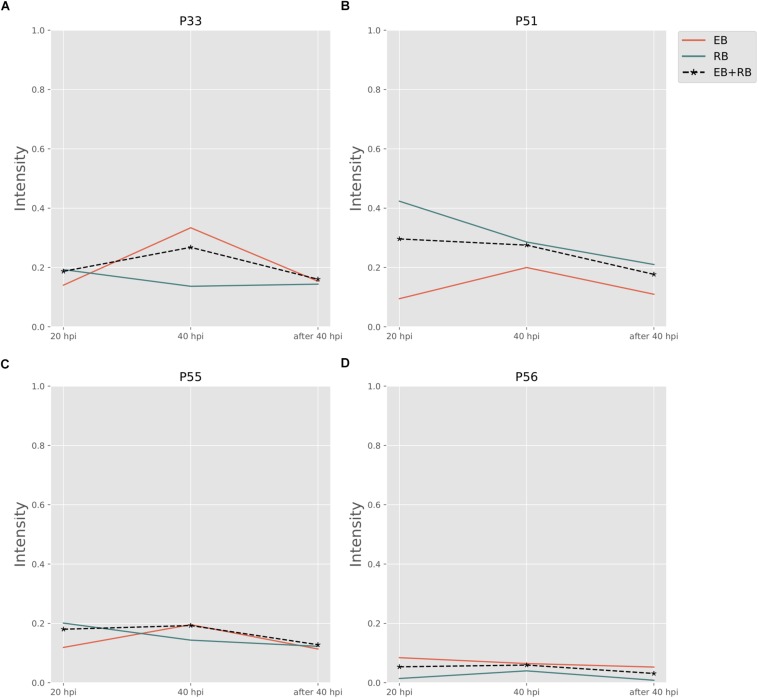
FIGURE 4.
Pathway activity changes of Folate biosynthesis in Ct during infection. (A) P33; (B) P51; (C) P55; and (D) P56 are all extreme pathways involved in synthesizing folate. EB flux changes are given by a red solid line and RB flux changes are shown as green solid line; the average flux change during infection (combining EB and RB as present during infection in the host cells) is given as black dashed line. The time course indicates the variation over infection from 20 hpi, 40 hpi and several hours (about 8 h) later after 40 hpi respectively. Flux intensities are normalized between zero and one (fully active).

