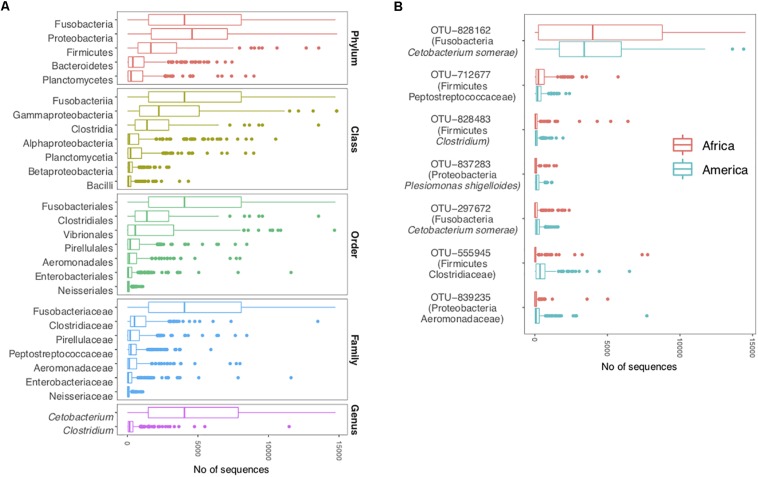
FIGURE 2.
The cichlid core microbiota (each taxon shared by at least 90% of the specimens). (A) Core taxa per individual taxonomic levels (from phylum to genus) and overall abundances across all specimens (sequence counts were binned by taxonomic rank). (B) Core OTUs and abundances separately for each continent. OTUs are shown along with their taxonomic classification assigned with a confidence ≥80% against the Greengenes database (phylum is followed by the highest taxonomic resolution achieved). Boxplots are centered at the median and whiskers show data dispersion across specimens. The analyses are based on the rarefied dataset (OTU_ALL_raref).

