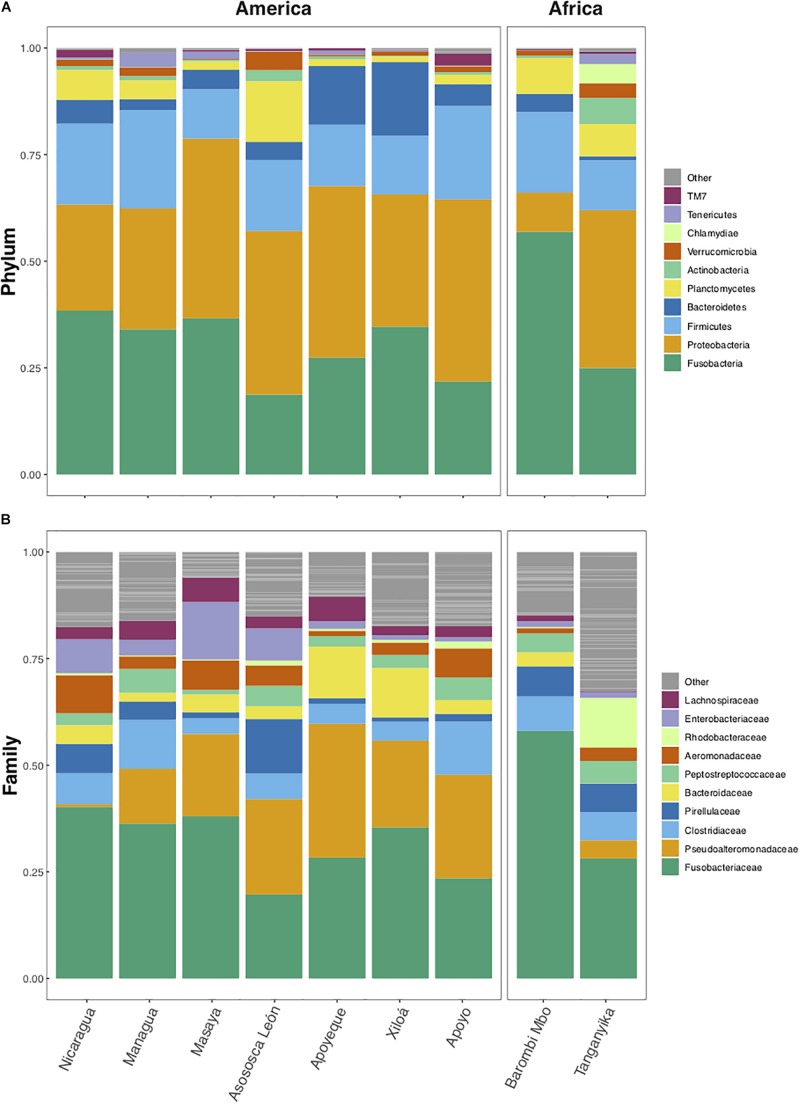
FIGURE 3.
Average relative abundance by lake of bacterial taxa at phylum (A) and family (B) levels. Dominant taxa are comparable across lakes and continents. Only the 10 most abundant phyla and families are color-coded, while “Others” (gray) include all remaining taxa. The analyses are based on the rarefied dataset (OTU_ALL_raref).

