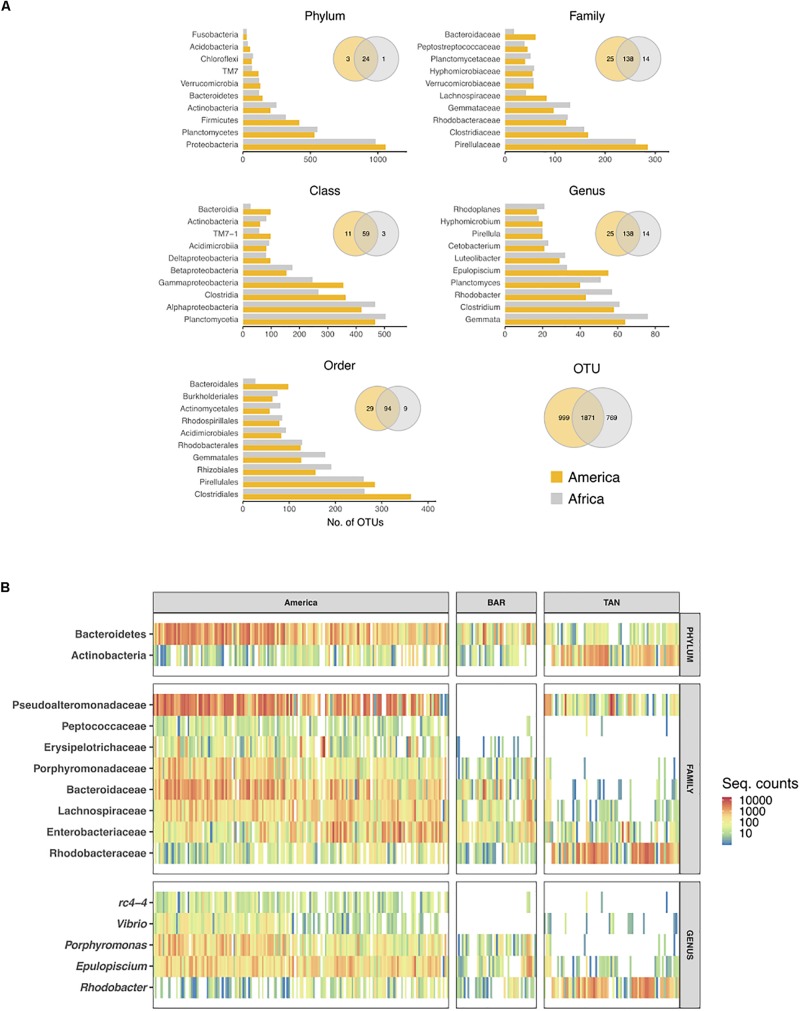
FIGURE 4.
Number of OTUs per bacterial taxon found in each continent (A) and heatmap of differentially abundant taxa between continents (ind. value ≥ 0.70, p ≤ 0.010) (B). (A) Total number of OTUs per taxon were calculated for each taxonomic rank. Only the 10 richest taxa are shown. Venn diagrams show unique and shared taxa/OTUs between continents. (B) Colors represent taxon abundance (i.e., sequence counts) per specimen (bar), with white indicating zero counts. For comparative purpose, African specimens were ordered and separated by lake. BAR: Barombi Mbo; TAN: Tanganyika. The indicator analyses are based on the rarefied dataset after additional sequence filtering (see section “Materials and Methods”).

