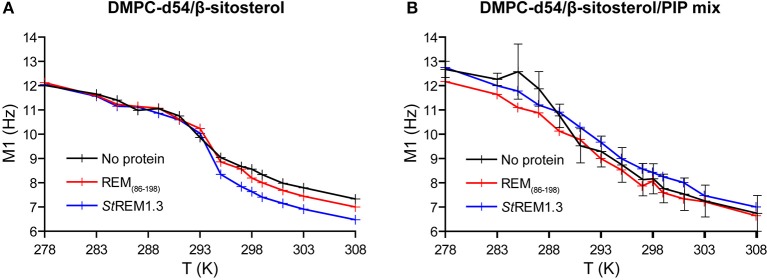
Figure 10.
Variation of first order spectral moments M1 as a function of temperature T in presence of REM86−198 or StREM1.3. Liposome compositions are (A) DMPC-d54/β-sitosterol 85/15 and (B) DMPC-d54/β-sitosterol/PIP mix 75/15/10 (molar ratio). Error bars are standard deviations of three independent experiments, as shown in Figure S1B.

