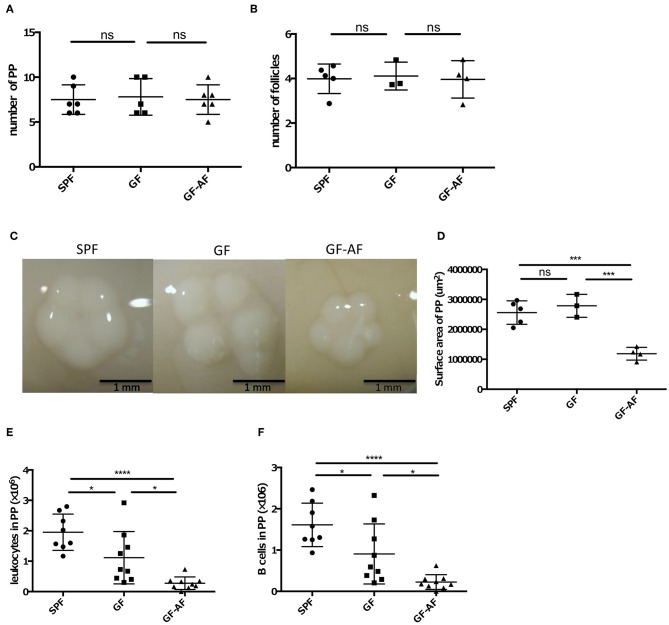
Figure 2.
The PPs in GF-AF mice are smaller than in SPF and GF mice. (A) The numbers of PP in SPF (n = 6), GF (n = 5), and GF-AF (n = 6) mice. Data are pooled from at least two independent experiments. (B) The average number of follicles per PP of SPF (n = 5), GF (n = 3), and GF-AF (n = 4) mice. Data are pooled from at least two independent experiments. (C) Representative images of PPs from SPF, GF and GF-AF mice. Bar, 1 mm. (D) The area of each PP was measured. Each point shows the average PP circumferences from one mouse. SPF (n = 5), GF (n = 3), and GF-AF (n = 4) mice were examined. Data are pooled from at least two independent experiments. (E) The number of leukocytes in PP of SPF (n = 8), GF (n = 9), and GF-AF (n = 9) mice. Data are pooled from at least three independent experiments. (F) The number of B cells (CD3− CD19+ lymphocytes) in PP of SPF (n = 8), GF (n = 9), and GF-AF (n = 9) mice. Data are pooled from at least three independent experiments. Mean ± SD are shown. One-way ANOVA with Tukey's post-hoc test was performed for statistical analysis. *p < 0.05, ***p < 0.001, ****p < 0.0001.

