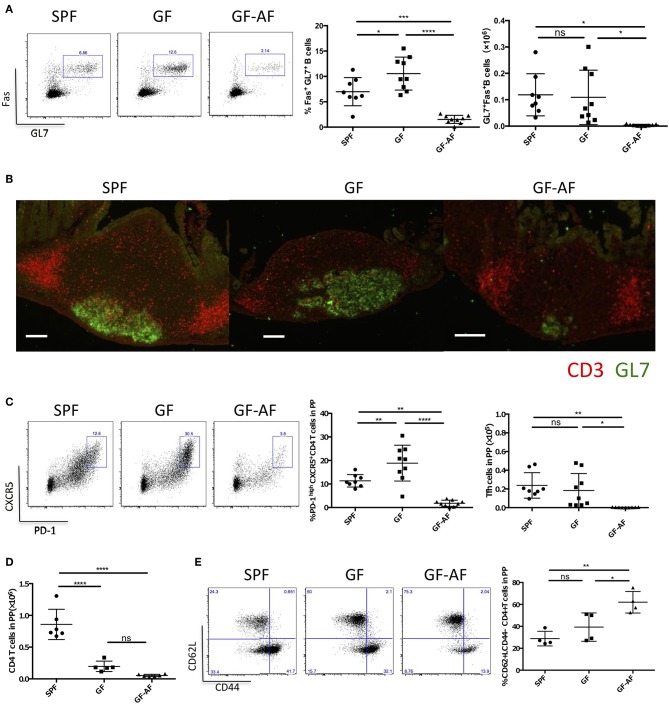
Figure 3.
The number of GC B cells and Tfh cells in PPs is dramatically decreased in GF-AF mice. (A) Representative flow cytometry plots of Fas vs. GL7 expression by PP B220+ CD19+ lymphocytes from SPF, GF, and GF-AF mice. The numbers in the boxes indicate percentage of Fas+ GL7+ cells in the gate (left). Percentages and absolute cell numbers of Fas+ GL7+ B cells in PPs are shown (right) (SPF; n = 8, GF; n = 9, and GF-AF; n = 9). Data are pooled from at least three independent experiments. (B) Vertical PP sections were stained with GL7 (green) and CD3 (red) antibodies to detect GC B cells and T cells (n = 3). Bars, 100 μm. This image is representative of two independent experiments. (C) Representative flow cytometry plots of CXCR5 vs. PD-1 expression by CD19− CD3+ CD4+ lymphocytes from PPs of SPF, GF, and GF-AF mice. The numbers in the boxes indicate percentage of CXCR5+ PD-1+ cells in the gate (left). Percentages and absolute cell numbers of CXCR5+ PD-1+ cells among CD19− CD3+ CD4+ lymphocytes of PP are shown (right). (SPF; n = 8, GF; n = 9, and GF-AF; n = 9). Data are pooled from at least three independent experiments. (D) Absolute number of CD3+ CD4+ lymphocytes. (SPF; n = 6, GF; n = 4, and GF-AF; n = 6). Data are pooled from at least three independent experiments. (E) Representative flow cytometry plots (left) and percentages of CD62L vs. CD44 among CD19− CD3+ CD4+ lymphocytes from PP of SPF (n = 4), GF (n = 4), GF-AF (n = 4) mice (right). Data are pooled from two independent experiments. Mean ± SD are shown. One-way ANOVA with Tukey's post-hoc test was performed for statistical analysis. *p < 0.05, **p < 0.01, ****p < 0.0001.

